
UNITED STATES SECURITIES AND EXCHANGE COMMISSION
WASHINGTON, D.C. 20549
FORM
(Mark One)
For the fiscal year ended:
OR
For the transition period from to
Commission file number:
(Exact name of registrant as specified in its charter)
|
||
(State or other jurisdiction of incorporation or organization) |
|
(I.R.S. Employer Identification No.) |
|
|
|
|
||
(Address of principal executive offices) |
|
(Zip Code) |
Registrant’s telephone number, including area code:
Securities registered pursuant to Section 12(b) of the Act:
Title of each class |
|
Trading Symbol(s) |
|
Name of each exchange on which registered |
|
|
Securities registered pursuant to Section 12(g) of the Act:
Common Stock, $0.01 Par Value
(Title of Class)
Indicate by check mark if the registrant is a well-known seasoned issuer, as defined in Rule 405 of the Securities Act. Yes ☐
Indicate by check mark if the registrant is not required to file reports pursuant to Section 13 or 15(d) of the Act. Yes ☐
Indicate by check mark whether the registrant (1) has filed all reports required to be filed by Section 13 or 15(d) of the Securities Exchange Act of 1934 during the preceding 12 months (or for such shorter period that the registrant was required to file such reports), and (2) has been subject to such filing requirements for the past 90 days. ☒
Indicate by check mark whether the registrant has submitted electronically every Interactive Data File required to be submitted pursuant to Rule 405 of Regulation S-T (§ 232.405 of this chapter) during the preceding 12 months (or for such shorter period that the registrant was required to submit such files). ☒
Indicate by check mark whether the registrant is a large accelerated filer, an accelerated filer, a non-accelerated filer, a smaller reporting company, or an emerging growth company. See the definitions of “large accelerated filer,” “accelerated filer,” “smaller reporting company,” and "emerging growth company" in Rule 12b-2 of the Exchange Act.
Large accelerated filer |
☐ |
|
Accelerated filer |
☐ |
☒ |
|
Smaller reporting company |
||
|
|
|
Emerging growth company |
If an emerging growth company, indicate by check mark if the registrant has elected not to use the extended transition period for complying with any new or revised financial accounting standards provided pursuant to Section 13(a) of the Exchange Act. ☐
Indicate by check mark whether the registrant has filed a report on and attestation to its management’s assessment of the effectiveness of its internal control over financial reporting under Section 404(b) of the Sarbanes-Oxley Act (15 U.S.C. 7262(b)) by the registered public accounting firm that prepared or issued its audit report.
Indicate by check mark whether the registrant is a shell company (as defined in Rule 12b-2 of the Exchange Act). Yes ☐ No
As of March 31, 2021, the last business day of the registrant’s most recently completed second fiscal quarter, the aggregate market value of the voting and non-voting stock held by non-affiliates of the registrant was approximately $
As of November 12, 2021, the registrant had outstanding
DOCUMENTS INCORPORATED BY REFERENCE
Portions of the Definitive Proxy Statement related to the registrant’s 2022 Annual Meeting of Shareholders, which Proxy Statement will be filed under the Securities Exchange Act of 1934, as amended, within 120 days of the end of the registrant’s fiscal year ended September 30, 2021, are incorporated by reference into Items 10-14 of Part III of this Form 10-K.
AMTECH SYSTEMS, INC. AND SUBSIDIARIES
Table of Contents
|
|
3 |
|
|
|
5 |
|
|
|
|
|
Part I |
|||
Item 1. |
|
6 |
|
Item 1A. |
|
17 |
|
Item 1B. |
|
29 |
|
Item 2. |
|
29 |
|
Item 3. |
|
30 |
|
Item 4. |
|
30 |
|
|
|
|
|
Part II |
|||
Item 5. |
|
31 |
|
Item 6. |
|
33 |
|
Item 7. |
|
Management’s Discussion and Analysis of Financial Condition and Results of Operations |
34 |
Item 7A. |
|
46 |
|
Item 8. |
|
46 |
|
Item 9. |
|
Changes in and Disagreements with Accountants on Accounting and Financial Disclosure |
78 |
Item 9A. |
|
78 |
|
Item 9B. |
|
78 |
|
Item 9C. |
|
Disclosure Regarding Foreign Jurisdictions that Prevent Inspections |
78 |
|
|
|
|
Part III |
|||
Item 10. |
|
79 |
|
Item 11. |
|
79 |
|
Item 12. |
|
Security Ownership of Certain Beneficial Owners and Management and Related Stockholder Matters |
79 |
Item 13. |
|
Certain Relationships and Related Transactions, and Director Independence |
79 |
Item 14. |
|
79 |
|
|
|
|
|
Part IV |
|||
Item 15. |
|
80 |
|
Item 16. |
|
80 |
|
83 |
|||
2
DEFINITIONS
Acronyms and defined terms used in the text include the following:
Term |
|
Meaning |
2007 Plan |
|
The 2007 Employee Stock Incentive Plan |
3D |
|
Three dimensional |
401(k) Plan |
|
The Amtech Systems, Inc. 401(k) Plan |
5G |
|
Fifth generation of mobile communications |
Amtech |
|
Amtech Systems, Inc. and Subsidiaries |
ASC |
|
Accounting Standard Codification |
ASU |
|
Accounting Standard Update |
Board |
|
The Board of Directors of Amtech Systems, Inc. |
Bruce Technologies |
|
Bruce Technologies, Inc. |
BTU |
|
BTU International, Inc. |
CAPM |
|
Capital Asset Pricing Model |
CARES Act |
|
Coronavirus Aid, Relief, and Economic Security Act |
CEO |
|
Chief Executive Officer |
CFO |
|
Chief Financial Officer |
CMP |
|
Chemical Mechanical Polishing |
Common Stock |
|
Our common stock, par value $0.01 per share |
Company |
|
Amtech Systems, Inc. and Subsidiaries |
COSO |
|
Committee of Sponsoring Organizations of the Treadway Commission |
COVID-19 |
|
A novel coronavirus strain commonly referred to as “coronavirus” |
DBC |
|
Direct Bond Copper |
EBIT EBITDA |
|
Earnings Before Interest and Taxes Earnings Before Interest, Taxes, Depreciation, and Amortization |
EPS |
|
Earnings (loss) per share |
ERISA |
|
Employee Retirement Income Security Act of 1974 |
EV |
|
Electric vehicle |
Exchange Act |
|
Securities Exchange Act of 1934, as amended |
FASB |
|
Financial Accounting Standards Board |
FDIC |
|
Federal Deposit Insurance Corporation |
FIFO |
|
First-in, first-out |
IBAL |
|
Individual boats with automated loading |
Intersurface Dynamics |
|
Intersurface Dynamics, Inc. |
ISO 9001:2015 |
|
International standard that specifies requirements for a quality management system |
IoT |
|
Internet of things |
Kingstone Hong Kong |
|
Kingstone Technology Hong Kong Limited |
LED |
|
Light-emitting diode |
LPCVD |
|
Low-pressure chemical vapor deposition |
MEMS |
|
Microelectromechanical systems |
mm |
|
Millimeter |
3
NIGPP |
|
National Integrated Group Pension Plan and Trust Fund |
Note __ |
|
Note __ to the consolidated financial statements |
O-S-D |
|
Optoelectronic Sensors & Discrete |
our |
|
Amtech Systems, Inc. and Subsidiaries |
PCAOB |
|
Public Company Accounting Oversight Board |
Power Semiconductor |
|
The fundamental component of modern power electronic circuitry. Power semiconductors perform the same tasks as regular semiconductors — only on a much larger scale. These high-performance components are capable of handling extremely high electrical currents, voltages, and frequencies. They are used in, but not limited to the following applications: electric vehicles, wireless communication, advanced control of electric drives, advanced computer systems, antennas, automobile sensors, broadband wireless, consumer and industrial electronics, and more. They form an indispensable part of electrical appliances, machines, and systems. |
PR Hoffman |
|
P.R. Hoffman Machine Products, Inc. |
Proxy Statement |
|
Amtech’s Proxy Statement to be filed with the SEC in connection with its 2022 Annual Meeting of Shareholders |
R2D |
|
R2D Automation SAS |
RD&E |
|
Research, development and engineering |
Registrant |
|
Amtech Systems, Inc. |
RF |
|
Radio Frequency |
ROU |
|
Right-of-use |
SEC |
|
Securities and Exchange Commission |
Securities Act |
|
Securities Act of 1933, as amended |
Semi |
|
Semiconductor |
SEO |
|
Search engine optimization |
SG&A |
|
Selling, general and administrative expenses |
SiC |
|
Silicon carbide |
SiC/LED |
|
Our former SiC/LED operating segment |
SMT |
|
Surface-mount technology |
SoLayTec |
|
SoLayTec B.V. |
SSP |
|
Standalone selling price |
Subsidiaries |
|
Subsidiaries of Amtech Systems, Inc. listed on Exhibit 21 hereto |
Tempress |
|
Tempress Systems, Inc. |
TTV |
|
Total thickness variation |
us |
|
Amtech Systems, Inc. and Subsidiaries |
U.S. |
|
The United States of America |
USA PATRIOT act |
|
The Uniting and Strengthening America by Providing Appropriate Tools to Restrict, Intercept, and Obstruct Terrorism Act of 2001 |
USTR |
|
United States Trade Representative |
we |
|
Amtech Systems, Inc. and Subsidiaries |
xEV |
|
Hybrid and electric vehicles |
4
Cautionary Statement about Forward-Looking Statements
Unless otherwise indicated, the terms “Amtech,” the “Company,” “we,” “us” and “our” refer to Amtech Systems, Inc. together with its subsidiaries.
Our discussion and analysis in this Annual Report on Form 10-K, our 2021 Annual Report to Shareholders, our other reports that we file with the SEC, our press releases and in public statements of our officers and corporate spokespersons contain “forward-looking” statements within the meaning of Section 27A of the Securities Act, Section 21E of the Exchange Act, and the Private Securities Litigation Reform Act of 1995. Forward-looking statements give our or our officers’ current expectations or forecasts of future events. You can identify these statements by the fact that they do not relate strictly to historical or current events. You can also identify forward-looking statements by discussions of strategy, plans or intentions of management. We have tried, wherever possible, to identify such statements by using words such as “may,” “plan,” “anticipate,” “seek,” “will,” “expect,” “intend,” “estimate,” “believe,” “continue,” “predict,” “potential,” “project,” “should,” “would,” “could,” “likely,” “future,” “target,” “forecast,” “goal,” “observe,” and “strategy” or the negative thereof or variations thereon or similar terminology relating to the uncertainty of future events or outcomes. Any expectations based on these forward-looking statements are subject to risks and uncertainties and other important factors. Some factors that could cause actual results to differ materially from those anticipated include, among others, future economic conditions, including changes in the markets in which we operate; changes in demand for our services and products; our revenue and operating performance; difficulties in successfully executing our growth initiatives; difficulties in executing on our strategic efforts with respect to our material and substrate business segment; the effects of competition in the markets in which we operate, including the adverse impact of competitive product announcements or new entrants into our markets and transfers of resources by competitors into our markets; the cyclical nature of the semiconductor industry; pricing and gross profit pressures; control of costs and expenses; risks associated with new technologies and the impact on our business; legislative, regulatory, and competitive developments in markets in which we operate; possible future claims, litigation or enforcement actions and the results of any such claim, litigation proceeding, or enforcement action; business interruptions, including those related to the COVID-19 pandemic and the cybersecurity incident that occurred in April 2021; the potential impacts of the COVID-19 pandemic, including ongoing logistical and supply chain challenges, and any future pandemic on our business operations, financial results and financial position; the severity, magnitude and duration of the COVID-19 pandemic, including impacts of the pandemic and of businesses’ and governments’ responses to the pandemic on our operations and personnel; the resolution of our cybersecurity incident and related costs; risks of future cybersecurity incidents; and the other factors included in this Annual Report on Form 10-K, including those referenced under the headings “Business,” “Risk Factors” and “Management’s Discussion and Analysis of Financial Condition and Results of Operations” or referenced from time to time in our filings with the SEC. The occurrence of the events described, and the achievement of expected results, depend on many events, some or all of which are not predictable or within our control. These and many other factors could affect Amtech’s future operating results and financial condition and could cause actual results to differ materially from expectations based on forward-looking statements made in this document or elsewhere by Amtech or on its behalf.
Forward-looking statements are neither historical facts nor assurances of future performance. Instead, they are based on our or our officers’ current beliefs, expectations and assumptions regarding the future of our business, future plans and strategies, projections, anticipated events and trends, the economy and other future conditions. Because forward-looking statements relate to the future, they are subject to certain risks and uncertainties. In light of these risks and uncertainties, there can be no assurance that the forward-looking information contained in this Annual Report on Form 10-K will in fact transpire or prove to be accurate. You should not place undue reliance on these forward-looking statements, which speak only as of the date they were made.
The Company undertakes no obligation to update or publicly revise any forward-looking statement whether as a result of new information, future developments or otherwise after the date of this Annual Report on Form 10-K. All subsequent written or oral forward-looking statements attributable to the Company or persons acting on its behalf are expressly qualified in their entirety by this cautionary statement. You are advised, however, to consult any further disclosures we make on related subjects in our subsequently filed Form 10-Q and Form 8-K reports and our other filings with the SEC. Also note that we provide a cautionary discussion of risks, uncertainties and possibly inaccurate assumptions relevant to our business under “Item 1A. Risk Factors” of this Annual Report on Form 10-K. We note these factors for investors as permitted by the Private Securities Litigation Reform Act of 1995. You should understand it is not possible to predict or identify all such factors.
5
PART I
ITEM 1. BUSINESS
OUR COMPANY
We are a leading, global manufacturer of capital equipment, including thermal processing and wafer polishing, and related consumables used in fabricating semiconductor devices, such as silicon carbide (SiC) and silicon power devices, analog and discrete devices, electronic assemblies, and light-emitting diodes (LEDs). We sell these products to semiconductor device and module manufacturers worldwide, particularly in Asia, North America and Europe. Our strategic focus is on semiconductor growth opportunities in power electronics, sensors and analog devices leveraging our strength in our core competencies in thermal and substrate processing. We are a market leader in the high-end power chip market (SiC substrates, 300mm horizontal thermal reactors, and electronic assemblies used in power, RF, and other advanced applications), developing, and supplying essential equipment and consumables used in the semiconductor industry.
We categorize each of our subsidiaries into one of two operating segments, based primarily on the industries they serve:
Operating Segment |
|
% of 2021 |
|
|
Semiconductor |
|
|
85 |
% |
Material and Substrate |
|
|
15 |
% |
These operating segments are comprised of the following four wholly-owned subsidiaries:
Semiconductor:
Material and Substrate:
Our strategic focus in the semiconductor industry is the development of equipment for thermal processing and deposition for semiconductor manufacturing, specifically focusing on substrate, fabrication, packaging and surface-mount technology (“SMT”). The markets we serve are experiencing technological advances and are, historically, cyclical. Therefore, future profitability and growth depend on our ability to invest in, develop and/or acquire and market new technology products and on our ability to adapt to cyclical trends.
Integrated circuits, optoelectronic, sensor, and discrete (O-S-D) components, such as power chips, LEDs, and some MEMS, are semiconductor devices fabricated on silicon and compound semiconductor, such as silicon carbide, wafer substrates. Semiconductor chips are part of the circuitry of many products including inverters, onboard charging, computers, telecommunications devices, automotive electronics and sensors, consumer electronics, and industrial automation and control systems. LEDs manufactured using our equipment are used in industrial, commercial and residential lighting. Our thermal processing and consumable products currently address the diffusion and deposition steps used in the fabrication of semiconductors, LEDs, MEMS and the polishing of newly sliced silicon and compound semiconductor wafers, as well as the packaging and assembly of the electronic components and assemblies. Our reflow ovens provide key thermal processing steps for both semiconductor packaging and electronics
6
assembly. Key end-markets for these packages and assemblies include: communications, automotive electronics and sensors, computing and networking, and consumer and industrial electronics.
Our Material and Substrate segment provides solutions to the lapping and polishing marketplace for SiC power chip applications, LED, optics, ceramics and photonics. Lapping and polishing are the processes of abrading components with a high degree of precision for flatness, parallelism and surface finish. Common applications for this technology are silicon wafers for semiconductor products, compound substrates, like silicon carbide wafers, for LED and power device applications, sapphire substrates for LED lighting and mobile devices, various glass and silica components for 3D image transmission, quartz and ceramic components for telecommunications devices, medical device components and optical and photonics applications.
We believe our product portfolio, developed through a track record of technological innovation as well as the successful integration of key acquisitions, provides exceptional value to semiconductor manufacturing by increasing yields, efficiency and throughput. We have been providing manufacturing solutions to the semiconductor industry for over 30 years and have leveraged our semiconductor technology and industry presence to capitalize on growth opportunities. Our customers use our equipment to manufacture semiconductor chips, silicon and compound semiconductor wafers and MEMS, which are used in end markets such as telecommunications (5G), consumer and industrial electronics (IoT and embedded devices), computing (data centers), automotive electronics and sensors (xEV), and mobile devices (smart devices). To complement our research and development efforts, we also sell our equipment to, and coordinate certain development efforts with, research institutes, universities and customers.
The semiconductor industry is cyclical and historically has experienced significant fluctuations. Our revenue is impacted by these broad industry trends.
In March 2020, the outbreak of COVID-19 was recognized as a pandemic by the World Health Organization, and the outbreak became increasingly widespread, including in all of the markets in which we operate. We continue to monitor the impact of COVID-19 on all aspects of our business. We are a company operating in a critical infrastructure industry, as defined by the U.S. Department of Homeland Security. Consistent with federal guidelines and with state and local orders to date, we have continued to operate across our footprint throughout the COVID-19 pandemic. Following the onset of COVID-19 and its negative effects on our business, most prominently reflected in our second, third and fourth quarter fiscal 2020 results, global economic conditions improved during fiscal 2021, resulting in increased demand for our products and services, which led to our earnings for fiscal 2021 substantially exceeding our fiscal 2020 results. There remain many unknowns and we continue to monitor the expected trends and related demand for our products and services and have and will continue to adjust our operations accordingly.
For information regarding net revenue, operating income and identifiable assets attributable to each of our two operating segments, see Note 17 of the Notes to Consolidated Financial Statements included in “Item 8. Financial Statements and Supplementary Data” and “Item 7. Management’s Discussion and Analysis of Financial Condition and Results of Operations” in this Annual Report. For information on the products of each operating segment, see “Semiconductor Products” and “Material and Substrate Products” within this “Item 1. Business” section. For information regarding risks to our business, see “Item 1A. Risk Factors.”
Our fiscal year is from October 1 to September 30. Unless otherwise stated, references to the years 2021, 2020 and 2019 relate to the fiscal years ended September 30, 2021, 2020 and 2019, respectively.
ACQUISITION
On March 3, 2021, we acquired 100% of the issued and outstanding capital stock of Intersurface Dynamics, a Connecticut-based manufacturer of substrate process chemicals used in various manufacturing processes, including semiconductors, silicon and compound semiconductor wafers, and optics, for a cash purchase price of $5.3 million. Intersurface Dynamics’ results of operations are included in our Material and Substrate segment from the date of acquisition.
7
GROWTH AND INVESTMENT STRATEGY
Historically, we have grown our business primarily through acquisitions, including the businesses that currently comprise our two operating segments in the Semiconductor and Material and Substrate industries: Bruce Technologies, BTU, PR Hoffman and Intersurface Dynamics. The businesses we own and operate today have provided substantial returns on our original investments. Our acquisition of BTU demonstrates our ability to unlock value in a company, to grow revenue and improve the performance of acquired assets. Our 2021 acquisition of Intersurface Dynamics bolstered our offerings in the substrate consumables space and incorporated wafer processing coolants and chemicals to our existing consumable and machine product lines. While we continue to believe this inorganic growth strategy is the backbone of who Amtech is as a company, we have also employed the complimentary strategy of pursuing organic growth, particularly during times when we lacked sufficient capital resources to pursue growth through acquisitions. During 2017 and 2018, the completion of several strategic transactions enabled us to build our capital foundation and renew our acquisition efforts; however, these acquisition efforts were temporarily interrupted by our focus on divesting of our Solar business beginning in 2019 and the impact of the COVID-19 pandemic in 2020. Despite these interruptions, we continued to invest in research and development and will introduce new products in fiscal 2022 to expand our offerings and addressable market. As we move past the pandemic interruptions, we have a renewed objective to grow our revenue and expand our operations through strategic acquisitions, while at the same time pursuing organic growth. We intend to accomplish these parallel objectives through the pursuit of the following strategies:
Capitalize on Growth Opportunities in the Semiconductor Industry by Leveraging Our Thermal and Material Processing Expertise, Top-Tier Customer Relationships, Track Record of Technological Innovation and Exceptional Customer Service. We believe that long-term growth in the semiconductor industry will be driven by emerging growth opportunities in advanced packaging technologies, new compound semiconductor substrates, such as silicon carbide and gallium nitride, and the growing demand for 5G and mobility, consumer and industrial Internet-of-Things (IoT), increased adoption of sensors and electronics in the automotive industry, electric vehicles (EV) and charging infrastructure, and China’s investment in their domestic semiconductor production capacity. As the semiconductor market continues to develop and evolve, advances in process technology will be vital to remaining competitive. We intend to continue leveraging our market position, relationships with leading global semiconductor customers and demonstrated track record of technological innovation and exceptional customer service to maximize sales of our current and next-generation technology solutions.
Develop Multi-Product Solutions to Expand Our Addressable Market. We are focused on acquiring, developing and licensing new products across our business in response to customer needs in the markets we serve. As we add to our product portfolio organically and through acquisitions, we plan to continue expanding our offerings within the semiconductor and silicon carbide production processes, thus capturing a greater percentage of capital spent on increasing semiconductor and silicon carbide production. We have successfully developed and acquired products to expand our addressable market and continue to make evolutionary upgrades to our existing equipment and service offerings across our operating segments. In addition to developing new products, we plan to invest in upgrades to our existing product offerings to stay competitive in the markets we serve. As a result, we increased our research and development expenses in 2021 and expect to continue to invest in capital expenditures and research and development expenses in fiscal 2022 and beyond for these evolutionary upgrades as well as for the development of specific new products. As a result of our research and development efforts, we intend to begin offering several new products as well as upgraded products in fiscal 2022.
Pursue Strategic Acquisitions That Complement Our Strong Platform. As discussed above, we have historically pursued an acquisition strategy consistent with our focus of maintaining market leadership and technology innovation that addresses the continued growth in the semiconductor industry. As part of this strategy, we continually evaluate potential technology, product and business acquisitions or joint ventures that we believe will increase our existing market share in the semiconductor and SiC industries and expand our addressable market. In evaluating these opportunities, our objectives include enhancing our earnings and cash flows, adding complementary product offerings, expanding our geographic footprint, improving our production efficiency and expanding our customer base. As a result, we continue to manage our balance sheet to maintain adequate liquidity so that we may react quickly as these opportunities arise. During 2021, we completed the acquisition of Intersurface Dynamics, which incorporated numerous coolants and chemical products to our existing consumable and machine product lines.
8
Invest in Our Infrastructure and Capacity. In the fourth quarter of 2020, we completed the move of our subsidiary, PR Hoffman, to a new location. This new location increased our manufacturing footprint and positioned our business to meet the expected longer-term increase in demand for our SiC, optics, and silicon substrate product solutions. Additionally, in the fourth quarter of 2021, we completed the move of our Shanghai facility to a new location. This new location increases our capacity and streamlines our manufacturing processes, thus reducing our lead times. In addition, we are evaluating our management information systems and needs in order to allow for greater efficiencies and to ensure our infrastructure can support our future growth plans.
SEMICONDUCTOR AND MATERIAL AND SUBSTRATE OPERATIONS
We provide diffusion and reflow thermal systems as well as wafer polishing equipment and related services to leading semiconductor manufacturers. Our products include horizontal diffusion furnaces used to produce semiconductors, such as analog, sensors, and discrete devices, and MEMS, as well as double-sided lapping and polishing equipment, double-sided lapping and polishing carriers, and single side polishing templates.
As demand for increasingly sophisticated electronic devices continues, new technologies such as electric vehicles, artificial intelligence, advanced power management, advances in consumer electronics, 5G communications, and IoT will help to drive future growth. Electronic equipment continues to become more complex, yet end users demand smaller, lighter and less expensive devices. This trend, in turn, requires increased performance and reduced cost of ownership requirements of electronic assemblies, printed circuit boards and semiconductors. In response to these developments, manufacturers are increasingly employing more sophisticated production and assembly techniques requiring more advanced manufacturing equipment, such as that supplied by our subsidiary, BTU.
Although the semiconductor market has experienced significant growth over the past fifteen years, it remains cyclical by nature. The market is characterized by short-term periods of under or over utilization of capacity for most semiconductors, including microprocessors, memory, power management chips and other logic devices. When capacity utilization decreases due to the addition of excess capacity, semiconductor manufacturers typically slow their purchasing of capital equipment. Conversely, when capacity utilization increases, so does capital spending. We believe the continued expansion of our consumable product offerings, primarily in our Material and Substrate segment, will enable us to partially offset some of these cyclical effects.
SEMICONDUCTOR PRODUCTS
Our furnace equipment is manufactured in our facilities in Massachusetts and China. The following paragraphs describe the products that comprise our current product lines in our semiconductor business:
Horizontal Diffusion Furnaces. Through Bruce Technologies, we produce and sell 200mm and 300mm horizontal diffusion and deposition furnaces. Our horizontal furnaces currently address several steps in the semiconductor manufacturing process, including diffusion, LPCVD, high temperature oxidation (used in silicon power chips), and annealing.
Our horizontal furnaces generally consist of three large modules: the load station, where the loading of the wafers occurs; the furnace section, which is comprised of one to four thermal reactor chambers; and the gas distribution cabinet, where the flow of gases into the reactor chambers is controlled and is often customized to meet the requirements of our customers’ particular processes. The horizontal furnaces utilize a combination of existing industry and proprietary technologies and are sold primarily to semiconductor customers. Our products are capable of processing all currently existing wafer sizes.
Continuous Thermal Processing Systems. Through BTU, we produce and sell thermal processing systems used in the solder reflow and curing stages of printed circuit board assembly as well as systems for the thermal processes used in advanced semiconductor packaging. Our printed circuit board assembly products are used primarily in the advanced, high-density segments of the market that utilize surface mount technology.
Flip-chip reflow provides the physical and electronic bond of the semiconductor device to its package. Our range of convection reflow systems, utilizing patented closed loop convection technology, are rated at up to 400°C
9
and operate in air or nitrogen atmospheres. These products are manufactured at our ISO 9001:2015 certified facility in Shanghai, China and utilize forced impingement convection technology to transfer heat to the substrate. Using configurable heating elements of up to eight kilowatts, they can process substrates in dual lane, dual speed configurations, thereby enabling our customers to double production without increasing the machine’s footprint. These products are available in four models based on the heated lengths of thermal processing chambers. Heated length is based on the required production rate and loading requirements.
High-Temperature Belt Furnace. We also produce and sell custom, high-temperature belt furnaces, which have been manufactured in Massachusetts for over six decades with ISO 9001:2015 quality certification safe-guarding that each unit is subject to exacting build and test criteria. These furnaces operate at temperatures up to 1200°C and are capable of processing in controlled atmospheres, such as nitrogen, argon and hydrogen. Applications include DBC, furnace brazing, annealing, glass to metal sealing, sintering and heat-treating for diverse markets including automotive, semiconductor, LED and medical.
Aqua Scrub Flux Management. In 2021, we began offering our Aqua Scrub Flux Management technology. The system continuously extracts flux-laden oven atmosphere from the reflow oven process chamber which is then passed through the Aqua Scrub system removing flux and returning clean atmosphere back to the reflow oven chamber. The aqueous-based scrubbing solution utilizes commonly available detergents for the rinse agent concentrate making it environmentally friendly. The system can be easily retrofitted to existing reflow ovens in the field due to its stand-alone design and small footprint.
FUTURE SEMICONDUCTOR PRODUCTS
The following paragraphs describe products currently in the final stages of development that we expect to begin offering to customers during fiscal year 2022 as part of our Semiconductor product lines:
Reflow. Our BTU division has begun a project to replace the current Pyramax reflow product with a next-generation platform. This updated platform will address areas of the market not currently served by the Pyramax line and provide existing customers with additional enhancements and capabilities. This next-generation platform will be launched in fiscal 2022 with full production commencing in 2023.
Selective Soldering. In March 2021, BTU entered into a distribution agreement with Hentec Industries, making BTU the exclusive distributor for Hentec products in Asia. BTU’s primary focus will be on the Hentec selective soldering product lines.
APEX Software. Our horizontal diffusion furnaces utilize a supervisory software system called APEX. In 2020, we embarked on a project to replace the current version, as it runs on a Unix operating system. This updated version will run on a Windows operating system and provide several new enhancements to our horizontal diffusion product line. This version will also provide an upgrade option for our existing base of customers.
MATERIAL AND SUBSTRATE PRODUCTS
Our Material and Substrate segment manufactures the products described below in Pennsylvania and Connecticut and sells them under our PR Hoffman and Intersurface Dynamics brand names.
Substrate Carriers. We manufacture carriers in a variety of sizes and materials. Sizes range from 3 to 38 inches in diameter using a variety of special steels, laminates and extruded polymer raw materials. Silicon wafers, compound semiconductor wafers, and large optics require these special insert carriers. These carriers combine the strength of hardened steel as the processing backbone with a softer plastic material in the work holes known as an insert. Inserts are permanently molded into the work holes via a pressurized process. These inserted work holes provide smoother processing, improved wafer total thickness variation (TTV) and improved wafer edge quality. Insert carriers are available for all wafer sizes from 75mm to 450mm and can be made from hardened and tempered carbon steel or specialized stainless steel when metal contamination is a processing concern. Insert carriers are widely accepted as the industry solution for both prime wafer and reclaim wafer manufacturers when dual sided lapping or polishing are utilized in their front-end wafer process.
10
Substrate Polishing Templates. Our polishing templates are used to securely hold silicon carbide, silicon, sapphire or other wafer materials in place during single-sided wax-free polishing processes. Polishing templates are customized for specific applications and are manufactured to extremely tight tolerances. We offer a variety of options to provide the best solution for each specific process. Polishing templates are manufactured for all brands of tools and virtually any wax-free customer process. Critical front-end wafer surface specifications are finalized during the polishing process.
Double-Sided Lapping and Polishing Machines. Double-sided lapping and polishing machines are designed to process materials such as silicon wafers, sapphire and other wafer-like materials, precision optics, computer disks, ceramic components, specialty metal products to exact tolerances of thickness, flatness, parallelism and surface finish. On average, we believe that we offer our surface processing systems with a lower cost of ownership than systems offered by our competitors. We target the compound substrate, semiconductor, optical sapphire, glass, quartz, ceramics, medical, computer disk and metal-working markets.
Substrate Process Chemicals. Through Intersurface Dynamics, we produce and sell substrate process chemicals which are used to achieve specific surface morphologies on a variety of materials. Our substrate process chemical customers include some of the world's largest manufacturers of semiconductor devices, silicon wafers, precision optics, ophthalmic lens, advanced displays and flat glass. We offer four different product lines: Tensor Series Products, Vector Series Products, Challenge Series Products and Big Blue Products. Tensor Series Products are used by manufacturers of integrated circuits in applications such as cleaning, etching, dicing and CMP. Vector Series Products were designed specifically for grinding, sawing, lapping, cleaning, etching and polishing semiconductor materials such as silicon wafers. Challenge Series Products address similar processes for manufacturers of precision optics, technical ceramics and advanced displays helping to achieve optimum yields. Big Blue Products are economical and easy to use, assuring quick, efficient manufacturing of flat glass and mirror products.
FUTURE MATERIAL AND SUBSTRATE PRODUCTS
The following paragraphs describe products currently in the final stages of development that we expect to begin offering to customers during fiscal year 2022 as part of our Material and Substrate product lines:
Single-Sided Polisher. We have developed a new single-side batch polisher to specifically to address the challenges in polishing compound semiconductor substrates, such as silicon carbide. Silicon carbide material is much harder than traditional silicon and requires additional capabilities not found on existing batch polishing systems in the market. Our single-side polishing equipment was designed to handle SiC wafers with a low cost of ownership and has enhanced throughput and cost of ownership when compared to single wafer CMP systems.
Double-Sided Polisher. The double-sided polisher is the newest evolution of our lapping and polishing systems with the capacity to handle 8-inch wafers, representing a 25% increase over our next largest tool. In addition, several enhancements have been added to provide our customers the ability to use the system for compound semiconductor substrates such as silicon carbide. True 4-way planetary motion allows us to increase material removal rate and provide better flatness. We designed this new system with increased downforce to provide the necessary pressure when lapping or polishing compound semiconductors. There are also other enhancements, such as chilled base plates to keep the system at lower temperatures during the processing cycles.
MANUFACTURING, RAW MATERIALS AND SUPPLY CHAIN
Our semiconductor manufacturing activities consist primarily of engineering design to meet specific and evolving customer needs and procurement and assembly of various commercial and proprietary components into finished thermal processing systems in North Billerica, Massachusetts and Shanghai, China.
Our manufacturing activities in the polishing business include laser-cutting and other fabrication steps in producing lapping and polishing consumables, including carriers, templates, gears, wear items and spare parts in our ISO 9001:2015 certified facility in Carlisle, Pennsylvania, from raw materials manufactured to our specifications by our suppliers. These products are engineered and designed for specific applications and to meet the increasingly tight tolerances required by our customers. Many items, such as proprietary components for our semiconductor equipment and lapping plates, are purchased from suppliers who manufacture these items to our specifications.
11
Final assembly and tests of our manufactured equipment and machines are performed within our manufacturing facilities. Quality control is maintained through inspection of incoming materials and components, in-process inspection during equipment assembly, testing of assemblies and final inspection and, when practical, operation of manufactured equipment prior to shipment.
Since much of our polishing supplies know-how relates to the manufacture of these products, our Carlisle facility is equipped to perform a significantly higher percentage of the fabrication steps required in the production of its products. However, injection molding for our insert carriers and the manufacture of raw cast iron plates and machine motors are subcontracted out to various third parties. Our polishing supplies business relies on key suppliers for certain materials, including specialized steel mills in Germany and Japan, an injection molding machine, a single-sourced pad supplier from Japan and an adhesive manufacturer. To minimize the risk of production and service interruptions and/or shortages of key parts, we seek to maintain appropriate inventory levels of key raw materials and parts.
Beginning in 2019 and throughout 2020 and 2021, we experienced increased lead-times for various parts and services across both our operating segments. In response to these increased lead-times, we have increased the amount of on-hand inventory and purchase order commitments related to long lead-time items. We have also increased on-hand inventory of certain parts as part of a strategy to mitigate supply chain risk, primarily at our operations in China, due to the trade and tariff environment between China and the United States. Despite these strategic increases, there can be no assurance that we will have enough inventory on-hand at the time we receive orders and that we will not incur delays in production time. Additionally, we may order items prior to receiving a customer order, which could result in increased inventory reserve expenses.
During 2021, we were also affected by the global shipping container shortage, which resulted in logistical challenges primarily related to shipments to and from China and, to a lesser extent, in other geographies including the U.S. and Europe. These challenges led to shipment delays to our customers as well as increased freight charges for both customer and vendor shipments. We expect these shipping trends to continue into fiscal 2022.
CUSTOMERS AND SEASONALITY
Our customers are primarily manufacturers of semiconductor substrates and devices and electronic assemblies. Additionally, our Material and Substrate segment also serves customers in the ceramics and optics industries. During 2021, 73% of our net revenue came from customers outside of North America. This group represented 65% of revenues in 2020. In 2021, net revenue was distributed among customers in different geographic regions as follows: North/South America 27% (22% of which is in the United States), Asia 58% (including 29% in China, 15% in Taiwan and 3% in Malaysia) and 15% in Europe. Two Semiconductor customers accounted for 14% and 13% of our net revenues in 2021. In 2020, one Semiconductor customer accounted for 11% of our net revenues.
Our business is not seasonal in nature, but is cyclical based on the capital equipment investment patterns of semiconductor manufacturers. These expenditure patterns are based on many factors, including capacity utilization, anticipated demand, the development of new technologies and global and regional economic conditions. Historically, these cycles typically last between 10-17 quarters, with each complete cycle made up of a contraction phase of about 4-6 quarters, followed by an expansion phase of roughly 6-11 quarters.
SALES AND MARKETING
Due to the highly technical nature of our products, we market our products primarily by direct customer contact through our sales personnel and through a network of domestic and international independent sales representatives and distributors that specialize in semiconductor equipment and supplies. Our promotional activities include direct sales contacts, participation in trade shows, advertising in trade magazines and digital marketing including website SEO and pay-per-click advertising.
We use a mix of direct sales, representatives and distributors globally. Manufacturer representatives provide sales coverage in specific geographic regions and are paid a commission when products are sold. Sales to distributors are generally on terms comparable to sales to end-user customers, as our distributors generally quote their customers
12
after first obtaining a quote from us and have an order from the end-user before placing an order with us. Our sales to distributors are not contingent on their future sales and do not include a general right of return. Historically, returns have been rare. Distributors of our semiconductor equipment do not stock a significant amount of our products, as the inventory they hold is generally limited to parts needed to provide timely repairs to customers. Our manufacturer representatives and distributors are closely managed by our global sales team.
Historically, each of our segments have been responsible for their own sales and marketing activities, including managing sales personnel and representative and distributor relationships, however, as we continue to refocus and grow our organization, we are developing opportunities for increased collaboration and teamwork across our divisions. These cross-segment collaboration opportunities will continue to be a focus at all levels and departments of the organization, as we believe they can lead to greater efficiencies while reducing operating costs. These efforts are further coordinated by our Vice President of Sales and Customer Service, who oversees all sales and marketing activities at each division.
RESEARCH, DEVELOPMENT AND ENGINEERING
The markets we serve are characterized by rapidly-evolving industry standards and technological change. To compete effectively, we must continually maintain or exceed the pace of such change by improving our products and our process technologies and by developing new technologies and products that are competitive based on price and performance. To assure that these technologies and products address current and future customer requirements, we obtain as much customer cooperation and input as possible, thus increasing the efficiency and effectiveness of our research and development efforts. In addition, we look for strategic acquisitions, that will provide us with new technologies to compete effectively in the markets in which we operate.
RD&E expenses may vary from period to period depending on the engineering projects in process. Expenses related to engineers working on strategic projects or sustaining engineering projects are recorded in RD&E. However, from time to time we add functionality to our products or develop new products during engineering and manufacturing to fulfill specifications in a customer’s order, in which case the cost of development, along with other costs of the order, are charged to cost of goods sold.
We periodically receive research grants for research and development of products, which are netted against our research, development and engineering costs. In 2021, 2020 and 2019, we recorded RD&E expense of $6.0 million, $3.3 million and $3.1 million, respectively. We plan to continue to develop new products and also to invest in upgrades to existing products to stay competitive in the markets we serve. As a result, we saw increased RD&E expenses in 2021 and expect to continue to increase our capital expenditures and RD&E expenses in fiscal 2022 and beyond for these upgrades as well as for the development of specific new products. As a result of these RD&E efforts, we expect to introduce several new products as well as upgraded products during fiscal 2022.
COMPETITION
We compete in several distinct equipment markets for semiconductor devices, semiconductor substrates, MEMS, semiconductor packaging, and electronics assembly, as well as the markets for supplies used in power semiconductor applications. Each of these markets is highly competitive. Our ability to compete depends on our ability to continually improve our products, processes and services, as well as our ability to develop new products that meet constantly evolving customer requirements. Significant competitive factors for succeeding in these markets include the product’s technical capability, productivity, cost-effectiveness, overall reliability, ease of use and maintenance, contamination and defect control and the level of technical service and support.
The Semiconductor and MEMS Markets. Equipment produced by our Semiconductor operating segment primarily competes with those produced by other original equipment manufacturers. Some of these manufacturers are well-established firms that are much larger and have substantially greater financial and other resources than we have with which to pursue development, engineering, manufacturing, marketing and distribution of their products. Additionally, these manufacturers may generally be better situated to withstand adverse economic or market conditions. Competitors of our horizontal diffusion furnaces include Centrotherm GmbH and CVD Equipment, Inc.
13
Our principal competitors for printed circuit board assembly equipment and advanced semiconductor packaging vary by product application. The principal competitors for solder reflow systems are ITW/EAE Vitronics-Soltec, Heller, Folungwin, ERSA, Shenzhen JT Automation Equipment Co., Ltd. and Rehm. The principal competitors for advanced semiconductor packaging are ITW/EAE Vitronics-Soltec and Heller. Our in-line, controlled atmosphere furnaces compete primarily against products offered by Centrotherm and SierraTherm/Schmid Thermal Systems. We also face competition from emerging low-cost Asian manufacturers and other established European manufacturers.
Although price is a factor in buying decisions, we believe that technological leadership, process capability, throughput, safer designs, uptime, mean time-to-repair, cost of ownership and after-sale support have become increasingly important factors to purchasers of our products. As such, we believe we compete primarily on the basis of these criteria, rather than on the basis of price alone.
General Industrial Lapping and Polishing Machines, Supplies and Semiconductor Substrate Markets. Our Material and Substrate operating segment experiences price competition for wafer carriers from foreign manufacturers for which there is very little publicly available information. As a result, we are intensifying our efforts to reduce the cost of our carriers and will continue to compete with other manufacturers of carriers by continuing to update our product line to keep pace with the rapid changes in our customers’ requirements and by providing a high level of quality and customer service. We produce steel carriers, including insert carriers, on advanced laser-cutting tools, which reduces our costs and lead times and increases our control over quality. Competitors of our lapping and polishing machines and supplies include Lapmaster Wolters, Speedfam Co. Ltd., Hamai Co., Ltd., Onse, Inc. and Eminess Technologies, Inc. Our new single-sided polishing machine, to be introduced in fiscal 2022, will compete with products offered by Applied Materials, Inc. and Revasum, Inc. However, we believe the automation options available with our machine will differentiate our product from others in the market. Our strategy to enhance our sales of wafer carriers and templates includes developing new applications in close collaboration with our customers, continuous improvement to our existing products and providing a high level of customer support and products that deliver greater value to our customers.
The competitive landscape in the substrate process chemical industry is varied, ranging from large multinational companies to small regional or regionally-focused companies. Intersurface Dynamics competes with much larger companies, such as Entegris, Inc. and Cabot. Our acquisition of Intersurface Dynamics coupled with PR Hoffman's product line allows us to be our customers' sole provider for their polishing processes, by providing the machinery, carriers, templates and slurry.
HUMAN CAPITAL
The Amtech Values
Amtech is focused on growth: company growth and employee growth. To encourage that growth, Amtech’s Chief Executive Officer and Chief Financial Officer developed Amtech’s core values, which are communicated to employees on a regular basis. These core values include the following:
14
Amtech’s Employees
Our management seeks to align employment levels with the needs of the business. We believe we have the appropriate human capital resources to successfully operate and execute our strategy. As of September 30, 2021, we employed 296 people. We also employ individuals on a temporary full-time basis and use the services of contractors as necessary. Of our 296 total employees, 36% were engaged in manufacturing, 18% were engaged in sales and service, 15% were engaged in research, development and engineering, and 31% were engaged in other roles. Our employees were based out of the following locations:
Of the 40 people employed at our Carlisle, Pennsylvania facility, 18 were represented by the United Auto Workers Union - Local 1443. We have a three-year agreement with this union, which expires on September 30, 2022. We expect this agreement to be renewed prior to expiration. We have never experienced a work stoppage or strike, and other than employees at the Carlisle facility, no other employees are represented by a union. At select business units, we have hired certain highly specialized employees under employment contracts that specify a term of employment, pay and other benefits. We consider our employee relations to be good.
Talent Acquisition and Retention
The future growth and success of our company largely depends on our ability to attract, train and retain qualified professionals. As part of our effort to do so, we offer competitive rewards, compensation and benefits, including an employee equity award program, performance-based bonuses, health and wellness benefits, retirement benefits, flexible schedules and holiday and paid time off. We understand that effective compensation and benefits programs are important in retaining high-performing and qualified individuals. Management is currently working with a consulting firm to study the competitiveness of our compensation programs for non-executive employees relative to their roles and responsibilities and the geographies they work in. Additionally, we continue to assess our healthcare and retirement benefits each year in order to provide competitive benefits to our employees.
We know that retention of high-performing employees benefits us and our customers. We are committed to helping our employees develop in their careers and thrive within the company. Management provides regular performance reviews to ensure our employees are receiving timely and constructive feedback, as well as rewards based on their performance. These performance reviews also assess each employee’s performance as it relates to Amtech’s Values. We believe these programs and efforts contribute to attracting and retaining a talented and driven workforce.
Turnover
In 2021, our total employee turnover was 14.9%, of which approximately 75.0% was voluntary. Approximately 18.2% of voluntary turnover were employees that retired from the workforce. The average tenure of our employees is approximately 10.5 years and approximately 48.5% of our employees have been employed with us for more than 10 years.
Diversity, Equity and Inclusion
Amtech is dedicated to building a diverse workforce, fostering a culture built on the principle of inclusion, and maintaining a workplace free from discrimination. We strongly believe that a diversity of experience, perspectives and backgrounds will lead to a better environment for our employees and better products and service for our customers.
15
Amtech’s commitment to diversity covers our Board of Directors, our leadership team and all teams and functions across our global locations.
Health and Safety
It is our highest priority to keep our employees, customers and suppliers safe. We provide our employees with ongoing safety training to ensure safety policies and procedures are communicated and implemented in an effective and timely manner.
During the ongoing COVID-19 pandemic, it is and has been our top priority to protect the safety and well-being of our employees and their families, our customers and our communities. Our commitment to this was evidenced by our response to the pandemic. We implemented work-from-home options for all our office personnel, where possible, and added additional shifts to reduce personnel in the building. Additionally, at our facilities, we followed enhanced safety and health protocols, including performing health checks and temperature screenings, practicing social distancing, providing personal protective equipment and increasing facility cleanings.
PATENTS
The following table shows our material patents and the expiration date of each patent:
Product |
|
Countries |
|
Expiration Date or Pending Approval |
IBAL (Individual Boats with Automated Loading) Model S-300 |
|
United States |
|
Various |
Ultrafast gas bearing-based reactive ion etching |
|
Europe |
|
2030 |
Modular furnace system |
|
United States |
|
2021 |
Convection furnace thermal profile enhancement |
|
United States |
|
2023 |
Lapping machine adjustable mechanism |
|
Various |
|
2027 |
RFID-containing carriers used for silicon wafer quality |
|
United States |
|
2030 |
Polishing machine wafer holder |
|
Various |
|
2037 |
Wafer Boat Elevator System and Method |
|
United States |
|
2021 |
To our knowledge, there are currently no pending lawsuits against us regarding infringement of any existing patents or other intellectual property rights or any material unresolved claims made by third parties that allege we are infringing the intellectual property rights of such third parties.
AVAILABLE INFORMATION
We file our annual report on Form 10-K, quarterly reports on Form 10-Q, Current Reports on Form 8-K, proxy statements, and other documents (including registration statements) with the SEC under the Securities Exchange Act of 1934 or the Securities Act of 1933, as applicable. Our SEC filings are available to the public on the SEC’s website at www.sec.gov and through The Nasdaq Global Select Market, 165 Broadway, New York, New York 10006, on which our common stock is listed.
AMTECH WEBSITE
In addition to the information contained in this Report, extensive information about Amtech can be found at www.amtechsystems.com, including information about our management team, products and services, and corporate governance practices. The corporate governance information on our website includes our Code of Conduct and the charters for each of the committees of the Board. In addition, amendments to these documents and waivers granted to directors and executive officers under the Code of Conduct, if any, will be posted in this area of the website. In addition, our filings with the SEC, as well as Section 16 filings made by any of our executive officers or directors with respect to Amtech's common stock, are available free of charge on our website as soon as reasonably practicable after the filing is electronically filed with, or furnished to, the SEC.
These details about our website and its content are only for information. The contents of our website are not, nor shall they be deemed to be, incorporated by reference in this Report.
16
ITEM 1A. RISK FACTORS
There are many factors that affect our business, financial condition, operating results and cash flows, as well as the market price for our securities. The following is a description of important factors that may cause our actual results of operations in future periods to differ materially from those currently expected or discussed in forward-looking statements set forth in this Report. The risks and uncertainties described below are not the only risks we face. We operate in a continually changing business environment. Additional risks and uncertainties not presently known to us or that we may currently deem immaterial also may impair our business operations. Forward-looking statements and such risks, uncertainties and other factors speak only as of the date of this Report, and we expressly disclaim any obligation or undertaking to update or revise any forward-looking statement contained herein, to reflect any change in our expectations with regard thereto, or any other change in events, conditions or circumstances on which any such statement is based, except to the extent otherwise required by law. The following risk factors should be read in conjunction with the other information and risks set forth herein. See "Forward Looking Statements."
Risks Related to the Semiconductor Industry
There is ongoing volatility in the semiconductor equipment industry.
The semiconductor equipment industry is highly cyclical and volatile. As such, demand for, and the profitability of, our products can change significantly from period to period as a result of numerous factors, including the following:
The purchasing decisions of our customers are highly dependent on their capacity utilization, which changes when new facilities are put into production and with the level of demand for our products, as well as our customers’ capital expenditure budgets. Purchasing decisions are also impacted by changes in the economies of the countries served by our customers, as well as the state of the worldwide industries in which we operate or expect to operate in the future. The timing, length and severity of the up-and-down cycles in the semiconductor equipment industry are difficult to predict. Additionally, we generally experience a one-to-two quarter lag between upturns/downturns experienced by larger equipment manufacturers.
When cyclical fluctuations result in lower than expected revenue levels, our operating results are adversely affected. Cost reduction measures may be necessary in order for us to remain competitive and financially sound. During a down cycle, our operating results may be adversely affected if we are unable to make timely adjustments to our cost and expense structure to correspond to the prevailing market conditions; effectively manage the supply chain; and motivate and retain key employees. In addition, during periods of rapid growth, our operating results may be adversely affected if we are unable to increase manufacturing capacity and personnel to meet customer demand, which may require additional liquidity. We can provide no assurance that we can timely and effectively respond to the industry cycles, and our failure to do so could have a material adverse effect on our business.
The semiconductor equipment industry is highly competitive and, because we are relatively small in size and have fewer financial and other resources compared to our competitors, we may not be able to compete successfully with them.
Our industry includes large manufacturers with substantial resources to support customers worldwide. Our future performance depends, in part, upon our ability to continue to compete successfully in these markets. Some of our competitors are diversified companies with extensive financial resources and research, engineering, manufacturing, marketing and customer service and support capabilities that are greater than ours. We face
17
competition from companies whose strategy is to provide a broad array of products, some of which compete with the products and services we offer. These competitors may bundle their products in a manner that discourages customers from purchasing our products. In addition, we face competition from emerging semiconductor equipment companies whose strategy is to provide a portion of the products and services that we offer often at a lower price than ours and use innovative technology to sell products into specialized markets. We also face competition from Chinese equipment manufacturers that may receive greater support than we do from Chinese customers and governmental agencies because they are locally based. In addition, our local Chinese competitors may offer lower prices and more liberal payment terms than ours. Loss of our competitive position due to any of these factors could impair our prices, customer orders, revenue, gross margin and market share, any of which would negatively affect our business, financial position and results of operations.
Risks Related to Our Business and Our Operations
Business interruptions, including those related to the novel strain of the coronavirus (COVID-19), have had an adverse impact on our operations, including among others, our manufacturing and supply chain, sales and product development and could have an adverse impact on our business, financial condition and results of operations in future periods.
The World Health Organization declared the outbreak of COVID-19 as a “pandemic,” or a worldwide spread of a new disease, on March 11, 2020. The outbreak resulted in government authorities and businesses throughout the world implementing numerous measures intended to contain and limit the spread of COVID-19, including travel bans and restrictions, quarantines, “shelter-in-place” and lock-down orders, and business limitations and shutdowns. These measures have negatively impacted consumer and business spending generally and have significantly contributed to deteriorating macroeconomic conditions. While governments around the world have taken steps to attempt to mitigate some of the more severe anticipated economic effects of COVID-19, there can be no assurance that such steps will be effective or achieve their desired results in a timely fashion.
While we continue to monitor and assess the impact on our business from the spread of COVID-19 and related new strains and the ever evolving actions implemented by governments across the globe, our global operations have returned to normal. The degree to which the coronavirus impacts our future business and operations will depend on future developments, which are highly uncertain and cannot be predicted with confidence, including the duration, spread and severity of the outbreak, new information which may emerge concerning the severity of the coronavirus and the actions to contain the coronavirus or treat its impact, among others. In particular, the continued spread and/or resurgence of the coronavirus globally and/or the emergence of new strains of the coronavirus, such as the Delta variant, could result in a widespread health crisis and/or change in consumer behavior that could adversely affect the global economy and financial markets, resulting in an economic downturn, and could also adversely impact our operations, including, without limitation, our manufacturing and supply chain, sales and product development operations, particularly our prospective sales if the Semiconductor and Material and Substrate business segments we seek to serve suffer long-term damage. Such an economic downturn could have an adverse impact on the successful and timely implementation of our strategic growth plan and on our business, financial condition and results of operations. We are similarly unable to predict the extent to which the pandemic impacts our customers, suppliers and other partners and their financial conditions, but adverse effects on these parties could also adversely affect us.
Finally, the impact of COVID-19 can also exacerbate other risks discussed in this Risk Factors section and throughout this report, which could in turn have a material adverse effect on us. Developments related to COVID-19 have been unpredictable, and additional impacts and risks may arise that we are not aware of or able to respond to appropriately.
We may not be able to generate sufficient cash flows or obtain access to external financing necessary to fund existing operations and planned expansions.
Cash flows may be insufficient to provide adequate working capital in the future and we may require additional financing for further implementation of our growth plans. There is no assurance that any additional financing will be available if and when required, or, even if available, that it would not materially dilute the ownership percentage of our then existing shareholders, result in increased expenses or result in covenants or special rights that would restrict our operations.
18
We may not be able to manage our business successfully through severe business cycles.
We may be unable to successfully expand or contract our business to meet fluctuating demands. Market fluctuations place significant strain on our management, personnel, systems and resources. To successfully manage our growth through such market fluctuations, we believe we must effectively:
We may encounter difficulties in effectively managing the budgeting, forecasting and other process control issues presented by rapidly changing business cycles. If we are unable to manage these cycles effectively, we may not be able to take advantage of market opportunities, develop new technologies and other products, satisfy customer requirements, execute our business plan or respond to competitive pressures.
Our inability to attract, train and retain effective employees and management could harm our business.
Our success depends upon the continued contributions of our executive officers and certain other employees, many of whom have many years of experience with us and would be extremely difficult to replace. We must also attract and retain experienced and highly skilled engineering, sales and marketing and managerial personnel. Competition for qualified personnel is intense in our industry, and we may not be successful in hiring and retaining these people. If we lost the services of our executive officers or our other highly qualified and experienced employees or cannot attract and retain other qualified personnel, our business could suffer through less effective management due to loss of accumulated knowledge of our business or through less successful products due to a reduced ability to design, manufacture and market our products.
Acquisitions can result in an increase in our operating costs, divert management’s attention away from other operational matters and expose us to other risks.
We continually evaluate potential acquisitions and consider acquisitions an important part of our future growth strategy. In the past, we have made acquisitions of, or significant investments in, other businesses with synergistic products, services and technologies and plan to continue to do so in the future. Acquisitions involve numerous risks, including, but not limited to:
19
Any of these risks could have a material adverse effect on our business, results of operations, financial condition, or cash flows, particularly in the case of a large acquisition. Moreover, our resources are limited and our decision to pursue a transaction has opportunity costs; accordingly, if we pursue a particular transaction, we may need to forgo the prospect of entering into other transactions that could help us achieve our financial or strategic objectives. No assurance can be given that we will be able to successfully complete future strategic acquisitions if we cannot reach agreement on acceptable terms or for other reasons. We may have to incur debt, issue equity securities or a combination of the foregoing to pay for any future acquisitions, the issuance of which could involve the imposition of restrictive covenants or be dilutive to our existing shareholders.
Our reliance on sales to a few major customers, often on credit terms, places us at financial risk.
We currently sell to a relatively small number of customers and expect to do so for the foreseeable future. Therefore, our operating results depend on the ability of these customers to sell products that require our equipment in their manufacture. Many of our customer relationships have developed over a short period of time and certain ones are in the early stages of development. The loss of sales to any of these customers would have a significant negative impact on our business. Additionally, our customers may cancel their agreements with us if we fail to meet certain product specifications, materially breach agreements or encounter insolvency or bankruptcy. They also may seek to renegotiate the terms of current agreements or renewals. We cannot be certain our existing customers will generate significant revenue for us in the future or that these new customer relationships will continue to develop. If we are unable to maintain or expand our customer base, we may not be able to maintain or increase our revenue.
In addition to having a relatively limited number of customers, we manufacture a limited number of products for each of our customers. If we lose any of our largest customers (as we have in the past from time to time), experience a significant reduction in sales to any such customers or no longer manufacture a particular product line for one of our largest customers, we would experience a significant reduction in our revenue.
As of September 30, 2021, one Semiconductor customer individually represented 14% of our accounts receivable. A concentration of our receivables from one or a small number of customers places us at risk. In such a scenario, a significant change in the liquidity or financial position of any of our customers that purchase large systems could have a material impact on the collectability of our accounts receivable and our future operating results. We attempt to manage this credit risk by requiring significant partial payments prior to shipment, where appropriate, and by actively monitoring collections. We also require letters of credit from certain customers depending on the size of the order, type of customer or its creditworthiness and its country of domicile. Our major customers may seek and, on occasion, may receive pricing, payment or other commercial terms that are less favorable to us than the current terms
20
we customarily obtain. If any one or more of our major customers were to seek to re-negotiate their agreements on more favorable terms, or not pay us or continue business with us, it could adversely affect our business, financial position and results of operations.
Our customers could cancel or fail to accept a large system order.
Our backlog includes orders for large systems, such as our horizontal diffusion furnaces, with system prices of up to and in excess of $1.0 million, depending on the system configuration, options and any special requirements of the customer. Some orders include multiple systems. Because our orders are typically subject to cancellation or delay by the customer, our backlog at any particular point in time is not necessarily representative of actual sales for succeeding periods. Our financial position and results of operations could be materially and adversely affected should any large systems order be canceled prior to shipment or not be accepted by the customer. Cancellations may result in inventory that we may not be able to sell or reuse if those products have been tailored for a specific customer’s requirements and cannot then be sold without significant incremental cost. We have experienced cancellations in the past. We cannot provide any assurance that we will realize revenue or profit from our backlog.
Manufacturing interruptions or delays could affect our ability to meet customer demand and lead to higher costs.
Our business depends on timely supply of equipment, services and related products that meet the rapidly changing technical and volume requirements of our customers. Some key parts to our products are subject to long lead times and/or are obtainable only from a single supplier or limited group of suppliers. Cyclical industry conditions and the volatility of demand for manufacturing equipment increase capital, technical, operational and other risks for us and for companies throughout our supply chain. Further, these conditions may cause some suppliers to scale back operations, exit businesses, merge with other companies, file for bankruptcy protection or possibly cease operations. We also may experience significant interruptions of our manufacturing operations, delays in our ability to deliver products or services, increased costs or customer order cancellations as a result of any of the following:
Because we depend on revenue from international customers, our business may be adversely affected by changes in the economies and policies of the countries or regions in which we do business.
In 2021, 73% of our net revenue came from customers outside of North America as follows: Asia - 58% (including China - 29%, Taiwan - 15% and Malaysia - 3%); and Europe - 15%.
Each geographic region in which we, our customers, and our suppliers operate exhibits unique characteristics that can cause capital equipment investment patterns to vary significantly from period to period. Our business and results of operations could be negatively affected by periodic local or international economic downturns, trade balance issues and political, social and military instability in countries such as China, India, South Korea, Taiwan and possibly elsewhere. In addition, we face competition from a number of suppliers based in Asia that have certain advantages over suppliers from outside of Asia. These advantages include lower operating, shipping and regulatory costs, proximity to customers, favorable tariffs and other government policies that favor local suppliers. Additionally, the marketing and sale of our products to international markets expose us to a number of risks, including the following:
21
Our business may be adversely affected by significant exchange rate fluctuations.
Though our business has not been materially affected in the past by currency fluctuations, there is a risk that it may be materially adversely affected in the future. Such risk includes possible losses due to currency exchange rate fluctuations, future prohibitions against repatriation of earnings, or proceeds from disposition of investments.
We are exposed to risks associated with an uncertain global economy.
Uncertain global economic conditions and slowing growth in China, Europe and the United States, along with difficulties in the financial markets, national debt concerns and government austerity measures in certain regions, pose challenges to the industries in which we operate. Related factors, including unemployment, inflation and fuel prices, exacerbate negative trends in business and consumer spending and may cause our customers to delay, cancel, or refrain from placing orders for equipment or services. These actions may, in turn, reduce our net sales, reduce backlog, and negatively affect our ability to convert backlog to sales. Uncertain market conditions, difficulties in obtaining capital, or reduced profitability also may cause some customers to scale back operations, exit businesses, merge with other manufacturers, or file for bankruptcy protection and potentially cease operations, which can result in lower sales and/or additional inventory or bad debt expense for us. These conditions may similarly affect key suppliers, impairing their ability to deliver parts and potentially causing delays or added costs for delivery of our products. In addition, these conditions may lead to strategic alliances by, or consolidation of, other equipment manufacturers, which could adversely affect our ability to compete effectively. Uncertainty about future economic and industry conditions also makes it more challenging for us to forecast our operating results, make business decisions, and identify and prioritize the risks that may affect our businesses, sources and uses of cash, financial condition and results of operations. We may be required to implement additional cost reduction efforts, including restructuring activities, and/or modify our business model, which may adversely affect our ability to capitalize on opportunities in a market recovery. If we do not timely and appropriately adapt to changes resulting from these uncertain macroeconomic environment and industry conditions, or to difficulties in the financial markets, our business, financial condition and results of operations may be materially and adversely affected.
If we fail to maintain optimal inventory levels, our inventory obsolescence costs could increase, our liquidity could be significantly reduced or our revenue could decrease.
While we must maintain sufficient inventory levels to operate our business successfully, meet our customers’ demands, and mitigate the possible impact of supply chain issues, accumulating excess inventory may have a significant unfavorable impact on our operating results and financial condition. Changing customer demands, supplier lead times and uncertainty surrounding new product launches expose us to risks associated with excess inventory or shortages. Our products are manufactured using a wide variety of purchased parts and raw materials and we must maintain sufficient inventory levels to meet the demand for the products we sell, which can change rapidly and unexpectedly. During peak years of our business, increases in demand for capital equipment result in longer lead times for many important system components. Future increases in demand could cause delays in meeting shipments to our customers. Because of the variability and uniqueness of customer orders, we try to avoid maintaining an extensive inventory of materials for manufacturing. However, long lead times for important system components during industry upturns sometimes require us to carry higher levels of inventory and make larger purchase commitments than we otherwise would make. We may be unable to sell sufficient quantities of products in the event that market demand
22
changes, resulting in increased risk of excess inventory that could lead to obsolescence or reduced liquidity as we fulfill our purchase commitments. Conversely, if we do not have a sufficient inventory of a product to fulfill customer orders, we may lose orders or customers, which may adversely affect our business, financial condition and results of operations. We may not be able to accurately predict market demand to avoid inventory shortages or build inventories and issue purchase commitments in excess of our current requirements.
Supplier capacity constraints, supplier production disruptions, supplier quality issues or price increases could increase our operating costs and adversely impact the competitive positions of our products.
We use numerous suppliers covering a wide range of materials and services in the production of our products including custom electronic and mechanical components. Key vendors include suppliers of controllers, quartz and silicon carbide for our diffusion systems, steel mills capable of producing the types of steel to the tolerances needed for our wafer carriers, an injection molding machine that molds plastic inserts into our steel carriers, an adhesive manufacturer that supplies the critical glue and a pad supplier that produces a unique material used in the manufacture of our polishing templates. We also rely on third parties for certain machined parts, steel frames and metal panels and other components used particularly in the assembly of our production equipment. Although we strive to ensure that parts are available from multiple suppliers, we procure some key parts from a single supplier or a limited number of suppliers. Thus, at times, certain parts may not be available in sufficient quantities, or on a timely and cost-efficient basis, to adequately meet our needs and the needs of our customers.
In the event of supplier capacity constraints, production disruptions, or failure to meet our requirements concerning quality, cost or performance factors, we may transfer our business to alternative sourcing which could lead to further delays, additional costs or other difficulties. If, in the future, we do not receive, in a timely and cost-effective manner, a sufficient quantity and quality of parts to meet our production requirements, our business, financial position and results of operations may be materially and adversely affected.
Our income taxes are subject to variables beyond our control.
Our net income and cash flow may be adversely affected by conditions affecting income taxes which are outside our control. Examples of the potential uncontrollable circumstances that could affect our tax rate are as follows:
Our officers, directors and largest shareholders could choose to act in their best interests and not necessarily those of our other shareholders.
Our directors, executive officers and holders of five percent or more of our outstanding common stock and their affiliates represent a significant portion of our common stock held as of September 30, 2021, and, therefore, have significant influence over our management and corporate policies. These shareholders have significant influence over all matters submitted to our shareholders, including the election of our directors and approval of business combinations, and could potentially initiate or delay, deter or prevent a change of control. Circumstances may occur in which the interests of these shareholders may conflict with the interests of Amtech or those of our other shareholders, and these shareholders may cause us to take actions that align with their interests. Should conflicts of interest arise, we can provide no assurance that these shareholders would act in the best interests of our other shareholders or that any conflicts of interest would be resolved in a manner favorable to our other shareholders. In addition, involvement of certain activist shareholders may impact our ability to recruit and retain talent or otherwise distract management or make decisions that we believe are in the long-term interest of all shareholders.
23
Information security breaches or failures of our information technology systems may have a negative impact on our operations and our reputation.
We may be subject to information security breaches or failures of our information technology systems caused by advanced persistent threats, unauthorized access, sabotage, vandalism, terrorism or accident. Compromises and failure to our information technology networks and systems could result in unauthorized release of our confidential or proprietary information, or that of our customers and suppliers, as well as employee personal data. The costs to protect against or alleviate breaches and systems failures require significant human and financial capital expenditures, which in turn could potentially disrupt our continuing operations, increase our liability as a result of compromises to personally identifiable information, and may lead to a material and adverse effect on our financial reporting, reputation and business.
On April 12, 2021, we detected a data incident in which attackers acquired data and disabled some of the technology systems used by one of our subsidiaries. Upon learning of the incident, we immediately engaged external counsel and retained a team of third-party forensic, incident response, and security professionals to investigate and determine the full scope of this incident. We also notified law enforcement officials and confirmed that the incident is covered by our insurance. We have completed the investigation of the data incident with assistance from our outside professionals, and indications were that the unauthorized third-party gained access to certain personal information relating to employees and their beneficiaries for some of our operations. There was no indication of any misuse of this information.
Despite this disruption, production continued in our facilities. Our previously disabled subsidiary network is now back up and running securely. Working alongside our security professionals, we were able to bring our subsidiary’s systems online with enhanced security controls. We have deployed an advanced next generation anti-virus and endpoint detection and response tool, as well as Managed Detection & Response services. We remain committed to protecting the security of the personal information entrusted to us and providing high-quality products and service to our customers.
We caution that this incident could result in future legal claims or proceedings, regulatory investigations or actions, and other types of liability under laws that protect the privacy and security of personal information, including federal, state and foreign data protection and privacy regulations, violations of which could result in significant judgements against us, penalties and fines. The cost of investigating, mitigating and responding to data incidents and complying with any applicable breach notification obligations to individuals, regulators, customers and others, including the April 2021 data incident, could be significant. To date, we have incurred approximately $1.1 million of related expense and received a reimbursement of $0.4 million. While our insurance policy has a specific payout limit, we expect that our claim will not exceed this limit, but that will depend on the ultimate amount of costs and other losses arising from such disruptions, failures, attempted attacks, or security breaches. In addition, such insurance may not be available to us in the future on economically reasonable terms, or at all. Further, defending a suit, regardless of its merit, could be costly, divert management attention and harm our reputation.
Natural disasters, outbreaks of infectious diseases, terrorist attacks, wars and threats of war may negatively impact our operations, revenue, costs, and stock price.
Natural disasters such as earthquakes, floods, severe weather conditions, outbreaks of infectious diseases in addition to COVID-19 or other catastrophic events may severely affect our operations or those of our suppliers and customers. Acts of terrorism, as well as events occurring in response or connection to them, including potential future terrorist attacks, rumors or threats of war, actual military conflicts or trade disruptions impacting our domestic or foreign customers or suppliers, may negatively impact our operations by causing, among other things, delays, or losses in the delivery of supplies or finished goods and decreased sales of our products. More generally, any of these events could cause consumer confidence and spending to decrease and/or result in increased volatility in the worldwide financial markets and economy. They also could result in economic recession either globally or in the markets in which we operate. Any of these occurrences could have a significant adverse impact on our business, financial position and results of operations.
24
Risks Related to Regulations and Litigation
Our business may be adversely affected by changes in or failure to comply with foreign and domestic laws.
Our operations are subject to numerous foreign and domestic regulatory regimes, including taxation policies, governance and audit requirements, employment and labor laws, transportation regulations, import and export regulations and tariffs, possible foreign exchange restrictions and international monetary fluctuations. Our policies, procedures and internal controls are designed to help us comply with all applicable foreign and domestic laws, accounting and reporting requirements, regulations and tax requirements. We could be subject to legal or regulatory action in the event of our failure to comply with any of the foregoing requirements, which could be expensive to defend and resolve and be disruptive to our business. Any changes in regulations, the imposition of additional regulations or the enactment of any new legislation that affects us may increase the complexity of the legal and regulatory environment in which we operate and the related costs of compliance.
We are subject to U.S. and certain non-U.S. anti-corruption/anti-bribery, export and import controls, sanctions, embargoes, anti-money laundering, anti-terrorist financing, and other similar laws and regulations. Compliance with these legal standards could impair our ability to compete in domestic and international markets. We can face criminal liability and other serious consequences for violations of these laws and regulations which can harm our business.
We are a U.S.-based multinational company with extensive operations in Asia and elsewhere. We operate in several high-risk jurisdictions, including, but not limited to China. Various U.S. and certain non-U.S. anti-corruption/anti-bribery and other international trade laws and regulations apply to our company entities and businesses. These laws and regulations may include, among others, the Foreign Corrupt Practices Act of 1977, as amended, the U.S. Travel Act, the U.S. Domestic Bribery Statute contained in 18 U.S.C. §201, the Money Laundering Control Act (1986), the USA PATRIOT Act, the United States Export Administration Act of 1979, the U.S. Export Administration Regulations (15 C.F.R. §§730 et seq.), U.S. sanctions contained in 31 C.F.R. Parts 500-599, the United States International Emergency Economic Powers Act, the United States Trading with the Enemy Act, the International Boycott Provisions of Section 999 of the U.S. Internal Revenue Code of 1986, the UK Bribery Act 2010, the UK Proceeds of Crime Act 2002, and certain other anti-corruption, anti-bribery, anti-kickback, anti-fraud, anti-money laundering, anti-terrorist financing, anti-narcotics, anti-boycott, export control, sanctions, embargo, import control, customs, tax, insider trading, insurance, banking, false claims, anti-racketeering, and other laws, regulations, decrees, government or executive orders, or judicial or administrative decisions or determinations to the extent applicable.
These laws and regulations are interpreted very broadly and will impact and raise legal compliance risks for our business in the various jurisdictions where we operate. Violations of any of these laws and regulations may result in substantial civil and criminal fines and penalties, imprisonment, the loss of export or import privileges, debarment, tax reassessments, breach of contract and fraud litigation, reputational harm, and other consequences.
Anti-corruption/anti-bribery and the other laws and regulations referred to above are actively enforced by U.S. and other government agencies. Among various matters, anti-corruption/anti-bribery laws prohibit our companies, subsidiaries, directors, officers, employees, agents, contractors, vendors, and other business partners from authorizing, promising, offering, providing, soliciting, or accepting directly or indirectly, improper payments or anything else of value to or from recipients in the public or private sector. We may engage vendors and third-party business partners to sell our products or services and/or to obtain necessary permits, licenses, patent registrations, and other regulatory approvals. We have direct or indirect interactions with officials and employees of government agencies or government-affiliated organizations. These factors raise our anti-corruption/anti-bribery risk exposure. We can be held liable for the corrupt or other illegal activities of our employees, agents, contractors, vendors, and other business partners, even if we do not explicitly authorize or have actual knowledge of such activities. The application of these laws to us also may place us at a competitive disadvantage to foreign companies that are not subject to similar regulations.
25
The United States could withdraw from or materially modify certain international trade agreements, or change tariff, trade, or tax provisions related to the global manufacturing and sales of our products in ways that we currently cannot predict.
A portion of our business activities are conducted in foreign countries, including China, Malaysia and Taiwan. Our business benefits from free trade agreements, and we also rely on various U.S. corporate tax provisions related to international commerce as we build, market and sell our products globally. Changes in U.S. or international social, political, regulatory and economic conditions could impact our business, reputation, financial condition and results of operations. In particular, political and economic instability, geopolitical conflicts, political unrest, civil strife, terrorist activity, acts of war, public corruption, expropriation, nationalism and other economic or political uncertainties in the United States or internationally could interrupt and negatively affect the sale of our products or other business operations. Any negative sentiment toward the United States as a result of any such changes could also adversely affect our business. In addition, changes in laws and policies governing foreign trade, manufacturing, development and investment in the territories or countries where we currently sell our products or conduct our business could adversely affect our business. U.S. presidential administrations have instituted or proposed changes in trade policies that include the negotiation or termination of trade agreements, the imposition of higher tariffs on imports into the U.S., economic sanctions on individuals, corporations or countries, and other government regulations affecting trade between the U.S. and other countries where we conduct our business. It may be time-consuming and expensive for us to alter our business operations in order to adapt to or comply with any such changes. Changes or proposed changes in U.S. or other countries' trade policies may result in restrictions and economic disincentives on international trade. Tariffs and other changes in U.S. trade policy have in the past and could in the future trigger retaliatory actions by affected countries, and certain foreign governments have instituted or are considering imposing retaliatory measures on certain U.S. goods. Further, any emerging protectionist or nationalist trends either in the United States or in other countries could affect the trade environment. The Company, similar to many other multinational corporations, does a significant amount of business that would be impacted by changes to the trade policies of the United States and foreign countries (including governmental action related to tariffs, international trade agreements, or economic sanctions). Such changes have the potential to adversely impact the U.S. economy or certain sectors thereof or the economy of another country in which we conduct operations, our industry and the global demand for our products, and as a result, could have a material adverse effect on our business, financial condition and results of operations. We are continuing to evaluate the impact of the announced and other proposed tariffs on products that we import from China, and we may experience a material increase in the cost of our products, which may result in our products becoming less attractive relative to products offered by our competitors.
These developments, or the perception that any of them could occur, may have a material adverse effect on global economic conditions and the stability of global financial markets, and may significantly reduce global trade and, in particular, trade between the impacted nations and the United States. Any of these factors, or any changes to U.S. corporate tax policies related to international commerce, could depress economic activity and have a material adverse effect on our business, financial condition and results of operations.
We are subject to environmental regulations, and our inability or failure to comply with these regulations could result in significant costs or the suspension of our ability to operate portions of our business.
We are subject to environmental regulations in connection with our business operations, including regulations related to manufacturing and our customers’ use of our products. From time to time, we receive notices regarding these regulations. It is our policy to respond promptly to these notices and to take any necessary corrective action. Our failure or inability to comply with existing or future environmental regulations could result in significant remediation liabilities, the imposition of fines and/or the suspension or termination of development, manufacturing or use of certain of our products or facilities, each of which could damage our financial position and results of operations.
We face a risk of product liability claims or other litigation, which could be expensive and may divert management’s attention from running our business.
Amtech and our subsidiaries are defendants from time to time in actions for matters arising out of our business operations. The manufacture and sale of our products, which, in our customers’ operations, involve toxic materials and robotic machinery, involve the risk of product liability claims. In addition, a failure of one of our products at a customer site could interrupt the business operations of our customer. Our existing insurance coverage limits may not be adequate to protect us from all liabilities that we might incur in connection with the manufacture and sale of our
26
products if a successful product liability claim or series of product liability claims were brought against us. As of September 30, 2021 and 2020, our accrued warranty costs at our continuing operations amounted to $0.5 million and $0.4 million, respectively. Our assumptions regarding the durability and reliability of our products may not be accurate, and because our products have relatively long warranty periods, we cannot assure you that the amount of accrued warranty by us for our products will be adequate in light of the actual performance of our products or that we won't experience higher than expected warranty claims. If we experience a significant increase in warranty claims, we may incur significant repair and replacement costs associated with such claims. Furthermore, widespread product underperformances or failures will damage our reputation and customer relationships and may cause our sales to decline, which in turn could have a material adverse effect on our business, financial condition and results of operations.
We also may be involved in other legal proceedings or claims and experience threats of legal action from time to time in the ordinary course of our business. For example, securities class action litigation is often brought against companies following periods of volatility in the market price of its securities or in connection with strategic transactions. We may in the future be the target of securities litigation due to volatility in the market price of our common stock or for other reasons. Any securities litigation could result in substantial costs and could divert the attention and resources of our management.
Where appropriate, we intend to vigorously defend all claims. However, any actual or threatened claims, even if not meritorious or material, could result in the expenditure of significant financial and managerial resources. The continued defense of these claims and other types of lawsuits could divert management’s attention away from running our business. In addition, required amounts to be paid in settlement of any claims, and the legal fees and other costs associated with their defense or settlement, cannot be estimated and could, individually or in the aggregate, materially harm our financial condition.
Risks Related to Our Research and Development and Intellectual Property Activities
We may not be able to keep pace with the rapid change in the technology needed to meet customer requirements.
Success in the semiconductor equipment industry depends, in part, on continual improvement of existing technologies and rapid innovation of new solutions. For example, the semiconductor industry continues to shrink the size of semiconductor devices. This and other evolving customer needs require us to continually respond with new product developments. Technical innovations are inherently complex and require long development cycles and appropriate professional staffing. Our future business success depends on our ability to develop and introduce new products, or new uses for existing products, that successfully address changing customer needs and win market acceptance. We also must manufacture these new products in a timely and cost-effective manner. To realize future growth through technical innovations in the semiconductor industry, we must acquire the technology through product development, merger and acquisition activity or through the licensing of products from our technology partners. Potential disruptive technologies could have a material adverse effect on our business if we do not successfully develop and introduce new products, technologies or uses for existing products in a timely manner and continually find ways of reducing the cost to produce them in response to changing market conditions or customer requirements.
Our research and development investments may not result in timely new products that can be sold at favorable prices and obtain market acceptance.
The rapid change in technology in our industry requires that we continue to make investments in research and development in order to enhance the performance, functionality and cost of ownership of our products to keep pace with competitors’ products and to satisfy customer demands for improved performance, features and functionality. We cannot provide assurance that revenue from future products or enhancements will be sufficient to recover the development costs associated with such products or enhancements, or that we will be able to secure the financial resources necessary to fund future development. Research and development costs are typically incurred before we confirm the technical feasibility and commercial viability of a product, and not all development activities result in commercially viable products. We cannot assure that products or enhancements will receive market acceptance, or that we will be able to sell these products at prices that are favorable to us, or at all. If we do not successfully manage
27
our investments in research and development, our business, financial condition and results of operations could be materially and adversely affected.
Third parties may violate our proprietary rights, in which we have made significant investments, resulting in a loss of value of some of our intellectual property or costly litigation.
Our success is dependent in part on our technology and other proprietary rights. We own various United States and international patents and have additional pending patent applications relating to some of our products and technologies. Protecting and defending our patents domestically, and especially internationally, is costly. In addition, the process of seeking patent protection is lengthy and expensive. Therefore, we cannot be certain that pending or future applications will result in issued patents, or that issued patents will be of sufficient scope or strength to provide meaningful protection or commercial advantage to us. Other companies and individuals, including our larger competitors, may develop technologies that are similar or superior to our technology or design around the patents we own or license. In addition, the patent for the technology that we license and use in our manufacture of insert carriers has expired, which, along with the other risks related to our patents described above, may have the effect of diminishing or eliminating any competitive advantage we may have with respect to our manufacturing process.
We also maintain trademarks on certain of our products and claim copyright protection for certain proprietary software and documentation. We can give no assurance, however, that our trademarks and copyrights will be upheld or will successfully deter infringement by third parties.
We attempt to protect our trade secrets and other proprietary information through confidentiality agreements with our customers, suppliers, employees and consultants and through other security measures. We also maintain exclusive and non-exclusive licenses with third parties for the technology used in certain products. However, these employees, consultants and third parties may breach these agreements, and we may not have adequate remedies for wrongdoing. In addition, the laws of certain territories, such as China, in which we develop, manufacture or sell our products may not protect our intellectual property rights to the same extent as do the laws of the United States.
We may face intellectual property infringement claims that could be time-consuming and costly to defend and could result in our loss of significant rights and the assessment of treble damages.
From time to time, we have received communications from other parties asserting the existence of patent rights or other intellectual property rights that they believe cover certain of our products, processes, technologies or information. Some of these claims may lead to litigation. We cannot assure that we will prevail in these actions, or that other actions alleging misappropriation or misuse by us of third-party trade secrets, infringement by us of third-party patents and trademarks or the validity of our patents, will not be asserted or prosecuted against us. If there is a successful claim of infringement against us, we may be required to pay substantial damages (including treble damages if we were to be found to have willfully infringed a third party’s patent) to the party claiming infringement, incur costs to develop non-infringing technology, stop selling or using technology that contains the allegedly infringing intellectual property, or enter into royalty or license agreements that may not be available on acceptable or commercially practical terms, if at all. Intellectual property litigation, regardless of outcome, is expensive and time-consuming, and could divert management’s attention from our business. Our failure to successfully defend against infringement claims, or to develop non-infringing technologies or license the proprietary rights on a timely basis, could have a material negative effect on our business, operating results or financial condition.
Risks Related to Our Common Stock
We have experienced, and may continue to experience, significant volatility in our stock price.
A variety of factors may cause the price of our stock to be volatile. For example, our results of operations are difficult to predict and have fluctuated from time to time in the past. We expect that our results of operations may continue to fluctuate from time to time in the future. It is possible that our results of operations in some reporting periods will be below market expectations. If our results of operations for a particular reporting period are lower than the market expectations for such reporting period, investors may react negatively and, as a result, the price of our stock may materially decline.
28
Furthermore, the stock market in general, and the market for shares of high-technology companies in particular, including ours, have experienced extreme price fluctuations, which have often been unrelated to the operating performance of affected companies. During the two-year period ended September 30, 2021, the price of our common stock has ranged from $14.24 to $3.55. The price of our stock may be more volatile than the stock of other companies due to, among other factors, the unpredictable, volatile and seasonal nature of the industries in which we operate, our significant customer concentration, intense competition, our fluctuating backlog and our relatively low daily stock trading volume. As a result, the market price of our common stock is likely to continue to fluctuate significantly in the future, including fluctuations related and unrelated to our performance.
Additional factors may affect our stock price, including sales of our common stock by us or our existing shareholders as well as changes to the coverage and/or rating of our stock by securities analysts.
Shareholder activists could cause a disruption to our business.
An activist investor may indicate disagreement with our strategic direction or capital allocation policies and may seek representation on our Board of Directors. Our business, operating results or financial condition could be adversely affected and may result in, among other things:
ITEM 1B. UNRESOLVED STAFF COMMENTS
None.
ITEM 2. PROPERTIES
We believe that our properties are adequate for our current needs. In addition, we believe that adequate space can be obtained to meet our foreseeable business needs. The following chart identifies the principal properties which we own or lease.
Location |
|
Use |
|
Own or Lease |
|
Size |
Corporate |
|
|
|
|
|
|
Tempe, Arizona |
|
Corporate Headquarters |
|
Own |
|
15,000 sf |
Semiconductor Segment |
|
|
|
|
|
|
North Billerica, Massachusetts |
|
Office, Mfg. & Warehouse |
|
Own |
|
150,000 sf |
Ashvale, Surrey, United Kingdom |
|
Office |
|
Lease |
|
1,900 sf |
Shanghai, China |
|
Office, Mfg. & Warehouse |
|
Lease |
|
76,530 sf |
Penang, Malaysia |
|
Office |
|
Lease |
|
1,570 sf |
Material and Substrate Segment |
|
|
|
|
|
|
Carlisle, Pennsylvania |
|
Office & Mfg. |
|
Lease |
|
40,500 sf |
Bethel, Connecticut |
|
Office & Mfg. |
|
Lease |
|
18,830 sf |
Our building in North Billerica, Massachusetts secures a mortgage note with a remaining balance of $4.8 million as of September 30, 2021 and a maturity date of September 26, 2023. The debt was refinanced in September 2016 with an interest rate of 4.00% as of September 30, 2021, which is the aggregate of the Federal Home Loan Board Five Year Classic Advance Rate plus two hundred forty basis points.
29
ITEM 3. LEGAL PROCEEDINGS
Amtech and its subsidiaries are defendants from time to time in actions for matters arising out of their business operations. We do not believe that any matters or proceedings presently pending will have a material adverse effect on our consolidated financial position, results of operations or liquidity.
ITEM 4. MINE SAFETY DISCLOSURES
Not applicable.
30
PART II
ITEM 5. MARKET FOR REGISTRANT’S COMMON EQUITY, RELATED STOCKHOLDER MATTERS AND ISSUER PURCHASES OF EQUITY SECURITIES
MARKET INFORMATION
Our common stock, par value $0.01 per share (Common Stock), is trading on the NASDAQ Global Select Market, under the symbol “ASYS.” The stock price details can be obtained from the Nasdaq website at www.nasdaq.com.
ISSUER PURCHASES OF EQUITY SECURITIES
Share Repurchase Program
On February 9, 2021, the Board approved a stock repurchase program, pursuant to which we may repurchase up to $4 million of our outstanding Common Stock over a one-year period, commencing on February 16, 2021. Repurchases under the program will be made in open market transactions at prevailing market prices, in privately negotiated transactions, or by other means in compliance with the rules and regulations of the SEC; however, we have no obligation to repurchase shares, and the timing, actual number, and value of shares to be repurchased is subject to management’s discretion and will depend on our stock price and other market conditions. We may, in the sole discretion of the Board, terminate the repurchase program at any time while it is in effect. Repurchased shares may be retired or kept in treasury for further issuance.
During the three months ended September 30, 2021, we did not repurchase any of our equity securities nor did we sell any equity securities that were not registered under the Securities Act of 1933, as amended.
HOLDERS
As of November 15, 2021, there were 338 shareholders of record of our Common Stock. Based upon a recent survey of brokers, we estimate there were approximately an additional 4,177 beneficial shareholders who held shares in brokerage or other investment accounts as of that date.
DIVIDENDS
We have never paid dividends on our Common Stock. Our present policy is to apply cash to investments in product development and upgrades, acquisitions or expansion; consequently, we do not expect to pay dividends on our Common Stock in the foreseeable future. However, once the above priorities have been met, we will evaluate the returning of capital to shareholders, as we have done in the past.
UNREGISTERED SALES OF EQUITY SECURITIES
There were no unregistered sales of equity securities in fiscal 2021.
31
COMPARISON OF STOCK PERFORMANCE
The following line graph and related information shall not be deemed “soliciting material” or “filed” with the SEC, nor shall such information be incorporated by reference into any future filings under the Securities Act of 1933 or the Exchange Act, each as amended, except to the extent that we specifically incorporated by reference it into such filing.
The following line graph compares cumulative total shareholder return, assuming reinvestment of dividends, for our Common Stock, the NASDAQ Composite Index and the NASDAQ Industrial Index. Because we did not pay dividends on our Common Stock during the measurement period, the calculation of the cumulative total shareholder return on our Common Stock did not include dividends. The following graph assumes that $100 was invested on October 1, 2016.
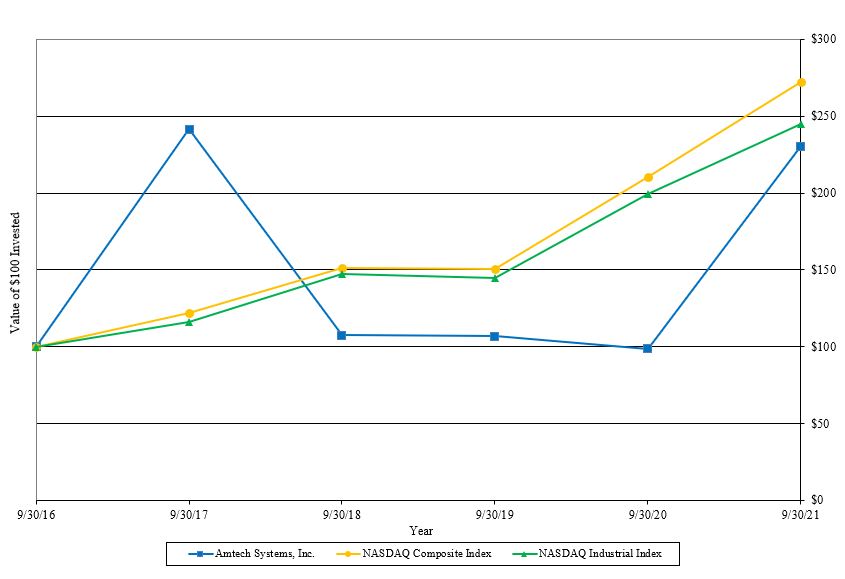
32
ITEM 6. SELECTED FINANCIAL DATA
The selected financial data presented below should be read in conjunction with "Item 7. Management’s Discussion and Analysis of Financial Condition and Results of Operations,” and our consolidated financial statements (including the related notes thereto) contained elsewhere in this report. The selected financial data in the table below excludes results from our discontinued operations.
|
|
Years Ended September 30, |
|
|||||||||||||||||
|
|
2021 |
|
|
2020 |
|
|
2019 |
|
|
2018 |
|
|
2017 |
|
|||||
Operating Data - Continuing Operations: |
|
|
|
|
|
|
|
|
|
|
|
|
|
|
|
|||||
Net revenue |
|
$ |
85,205 |
|
|
$ |
65,463 |
|
|
$ |
85,035 |
|
|
$ |
100,053 |
|
|
$ |
83,073 |
|
Gross profit |
|
$ |
34,530 |
|
|
$ |
24,441 |
|
|
$ |
33,357 |
|
|
$ |
36,918 |
|
|
$ |
31,106 |
|
Gross margin |
|
|
41 |
% |
|
|
37 |
% |
|
|
39 |
% |
|
|
37 |
% |
|
|
37 |
% |
Operating income (loss) (1) |
|
$ |
3,725 |
|
|
$ |
(485 |
) |
|
$ |
4,916 |
|
|
$ |
6,072 |
|
|
$ |
3,641 |
|
Income (loss) attributable to continuing |
|
$ |
1,508 |
|
|
$ |
(3,907 |
) |
|
$ |
3,135 |
|
|
$ |
6,631 |
|
|
$ |
2,194 |
|
|
|
|
|
|
|
|
|
|
|
|
|
|
|
|
|
|||||
Income (loss) per share attributable to |
|
|
|
|
|
|
|
|
|
|
|
|
|
|
|
|||||
Basic income (loss) per share |
|
$ |
0.11 |
|
|
$ |
(0.28 |
) |
|
$ |
0.22 |
|
|
$ |
0.45 |
|
|
$ |
0.16 |
|
Diluted income (loss) per share |
|
$ |
0.11 |
|
|
$ |
(0.28 |
) |
|
$ |
0.22 |
|
|
$ |
0.44 |
|
|
$ |
0.16 |
|
|
|
|
|
|
|
|
|
|
|
|
|
|
|
|
|
|||||
Backlog: |
|
$ |
44,143 |
|
|
$ |
13,905 |
|
|
$ |
17,326 |
|
|
$ |
26,291 |
|
|
$ |
24,742 |
|
|
|
|
|
|
|
|
|
|
|
|
|
|
|
|
|
|||||
Balance Sheet Data - Continuing Operations: |
|
|
|
|
|
|
|
|
|
|
|
|
|
|
|
|||||
Cash, cash equivalents and restricted cash |
|
$ |
32,836 |
|
|
$ |
45,070 |
|
|
$ |
53,083 |
|
|
$ |
45,915 |
|
|
$ |
41,005 |
|
Total assets (3) |
|
$ |
116,913 |
|
|
$ |
102,098 |
|
|
$ |
103,722 |
|
|
$ |
104,084 |
|
|
$ |
99,788 |
|
Total current liabilities (4) |
|
$ |
15,109 |
|
|
$ |
7,477 |
|
|
$ |
12,101 |
|
|
$ |
15,763 |
|
|
$ |
15,605 |
|
Current maturities of long-term debt |
|
$ |
396 |
|
|
$ |
380 |
|
|
$ |
371 |
|
|
$ |
350 |
|
|
$ |
336 |
|
Long-term debt |
|
$ |
4,402 |
|
|
$ |
4,798 |
|
|
$ |
5,178 |
|
|
$ |
5,542 |
|
|
$ |
5,892 |
|
33
ITEM 7. MANAGEMENT’S DISCUSSION AND ANALYSIS OF FINANCIAL CONDITION AND RESULTS OF OPERATIONS
The following discussion of our financial condition and results of operations should be read together with our Consolidated Financial Statements and the accompanying notes included in "Item 8. Financial Statements and Supplementary Data” in this Annual Report on Form 10-K. This discussion contains forward-looking statements, which involve risks and uncertainties. Our actual results could differ materially from those anticipated in the forward-looking statements as a result of certain factors including, but not limited to, those described in “Risk Factors” and elsewhere in this Annual Report on Form 10-K. Please refer to page 5 for further information regarding forward-looking statements and “Item 1A. Risk Factors” for a description of our risk factors.
Overview
We are a leading, global manufacturer of capital equipment, including thermal processing and wafer polishing and related consumables used in fabricating semiconductor devices, such as silicon carbide ("SiC") and silicon power devices, analog and discrete devices, electronic assemblies, and light-emitting diodes ("LEDs"). We sell these products to semiconductor device and module manufacturers worldwide, particularly in Asia, North America and Europe.
We operate in two reportable business segments, based primarily on the industries they serve: (i) Semiconductor and (ii) Material and Substrate. In our Semiconductor segment, we supply thermal processing equipment, including solder reflow ovens, horizontal diffusion furnaces, and custom high-temp belt furnaces for use by semiconductor, electronics and electro/mechanical assembly manufacturers. Our semiconductor customers are primarily manufacturers of integrated circuits and optoelectronic sensors and discrete ("O-S-D") components used in analog, power and radio frequency ("RF"). In our Material and Substrate segment, we produce substrate consumables, chemicals and machinery for lapping (fine abrading) and polishing of materials, such as silicon wafers for semiconductor products, sapphire wafers for LED applications, and compound substrates, like silicon carbide wafers, for power device applications.
The semiconductor industry is cyclical, but not seasonal, and historically has experienced fluctuations. Our revenue is impacted by these broad industry trends.
We continue to focus on our plans to profitably grow our business and have developed a strategic growth plan and a capital allocation plan that we believe will support our growth objectives. Our Power Semiconductor strategic growth plan leverages our experience, products and capabilities in pursuit of growth, profitability and sustainability. Our core focus areas are:
34
We anticipate that the required investments to achieve our revenue growth targets will be in the range of $6.0 - $8.0 million in research and development and capital expenditures, which also includes investments in management information systems and capacity expansions at existing manufacturing facilities. Additionally, we may decide to divest some or all of our real estate holdings to streamline our balance sheet and provide additional working capital for our investments and research and development needs. In the fourth quarter of 2021, we completed the move of our Shanghai facility to a new location. This new location increases our capacity and allows us to streamline our manufacturing processes, thus reducing our lead times. In addition, we are evaluating our management information systems and needs in order to allow for greater efficiencies and to ensure our infrastructure can support our future growth plans. We are and will continue to closely scrutinize these planned investments, in light of the COVID-19 challenges, and we may defer some of our projects. However, as a capital equipment manufacturer, we will continue to invest in our business to fuel our future growth.
In addition to investments in our organic growth, another key aspect of our capital allocation policy is our plan to grow through acquisitions. We have the expertise and track record to identify strong acquisition targets in the semi and SiC growth environments and to execute transactions and integrations to provide for value creating, profitable growth in both the short-term and long-term. On March 3, 2021, we acquired Intersurface Dynamics, a Connecticut-based manufacturer of substrate process chemicals used in various manufacturing processes, including semiconductors, silicon and compound semiconductor wafers, and optics. As of the date of the filing of this Annual Report on Form 10-K, we do not have an agreement to acquire any acquisition target.
Cybersecurity Incident
On April 12, 2021, we detected a data incident in which attackers acquired data and disabled some of the technology systems used by one of our subsidiaries. Upon learning of the incident, we immediately engaged external counsel and retained a team of third-party forensic, incident response, and security professionals to investigate and determine the full scope of this incident. We also notified law enforcement officials and confirmed that the incident is covered by our insurance. We have completed the investigation of the data incident with assistance from our outside professionals, and indications were that the unauthorized third-party gained access to certain personal information relating to employees and their beneficiaries for some of our operations. There was no indication of any misuse of this information.
Despite this disruption, production continued in our facilities. Our previously disabled subsidiary network is now back up and running securely. Working alongside our security professionals, we were able to bring our subsidiary’s systems online with enhanced security controls. We have deployed an advanced next generation anti-virus and endpoint detection and response tool, as well as Managed Detection & Response services. We remain committed to protecting the security of the personal information entrusted to us and providing high-quality products and service to our customers.
We recorded approximately $1.1 million of expense related to this incident, which is included in selling, general and administrative expenses, during the third quarter of fiscal 2021. The expense is primarily related to third-party service providers, including security professionals as well as legal and response teams. We may make additional investments in the future to further strengthen our cybersecurity. We filed an insurance claim during the fourth quarter of fiscal 2021 related to the incident. Disputes over the extent of insurance coverage for claims are not uncommon, and there will be a time lag between the initial incurrence of costs and the receipt of any insurance proceeds. There is no guarantee that we will be fully reimbursed for all expenses incurred. As of September 30, 2021, we have been approved for a reimbursement of approximately $0.4 million and received a request for additional information related to certain items in our claim.
COVID-19
In March 2020, the outbreak of COVID-19 was recognized as a pandemic by the World Health Organization, and the outbreak became increasingly widespread, including in all of the markets in which we operate. We continue to monitor the impact of COVID-19 on all aspects of our business. We are a company operating in a critical infrastructure industry, as defined by the U.S. Department of Homeland Security. Consistent with federal guidelines and with state and local orders to date, we have continued to operate across our footprint throughout the COVID-19
35
pandemic. Following the onset of COVID-19 and its negative effects on our business, most prominently reflected in our second, third and fourth quarter fiscal 2020 results, global economic conditions improved during fiscal 2021, resulting in increased demand for our products and services, which led to our earnings for fiscal 2021 substantially exceeding our fiscal 2020 results. There remain many unknowns and we continue to monitor the expected trends and related demand for our products and services and have and will continue to adjust our operations accordingly. Please see additional information in “Item 1A. Risk Factors.”
Solar and Automation Divestitures
In April 2019, we announced that the Board determined that it was in the long-term best interest of Amtech to exit the Solar business segment and to focus our strategic efforts on our non-Solar business segments in order to more fully realize the opportunities presented in those segments. The divestiture included our Tempress and SoLayTec subsidiaries, which comprised substantially all of our Solar segment.
Effective January 22, 2020 (“Tempress Sale Date”), we completed the sale of Tempress for nominal consideration to a third party located in the Netherlands. We recorded a pre-tax loss on sale of approximately $10.9 million, of which approximately $7.2 million was the recognition of previously recorded accumulated foreign currency translation losses. The total pre-tax loss did not have a material effect on our cash balances at our continuing operations. We also recognized a significant tax benefit relating to this loss, which can be carried over to future years. Effective on the Tempress Sale Date, Tempress is no longer included in our consolidated financial statements.
The portion of our Solar segment not included in discontinued operations is our previously reported Automation division, R2D. R2D had historically sold automation products to both solar and semiconductor customers. On December 13, 2019 (“R2D Sale Date”), we finalized the sale of R2D to certain members of R2D’s management team. Upon the sale, we recognized a loss of approximately $2.8 million. Effective on the R2D Sale Date, R2D is no longer included in our consolidated financial statements.
Segment Reporting Changes
Upon the acquisition of Intersurface Dynamics in the second quarter of 2021, we evaluated our organizational structure and concluded that we have two reportable business segments following the acquisition. Our Material and Substrate segment includes our former SiC/LED segment in addition to Intersurface Dynamics beginning at the date of acquisition.
In the second quarter of 2019, we began the process to divest our solar business, which we completed on January 22, 2020 with the sale of our Tempress subsidiary. As such, we have reported the results of the Solar segment as discontinued operations in our Consolidated Statements of Operations for 2019 and 2020.
Industry Fluctuations
Our quarterly and annual operating results have been and will continue to be impacted by the timing of large system orders. Further, the semiconductor equipment industry is highly cyclical, and the conditions of this industry remain volatile. Therefore, our order flow fluctuates quarter to quarter. For additional information regarding the risks related to our business and industry, please refer to "Item 1A. Risk Factors" within this Form 10-K.
Fiscal Year
Our fiscal year is from October 1 to September 30. Unless otherwise stated, references to the years 2021, 2020 and 2019 relate to the fiscal years ended September 30, 2021, 2020 and 2019, respectively.
36
Results of Operations
The following table sets forth certain financial data as a percentage of net revenue for the periods indicated:
|
|
Years Ended September 30, |
|
|||||
|
|
2021 |
|
|
2020 |
|
||
Net revenue |
|
|
100 |
% |
|
|
100 |
% |
Cost of sales |
|
|
59 |
% |
|
|
63 |
% |
Gross margin |
|
|
41 |
% |
|
|
37 |
% |
Selling, general and administrative |
|
|
29 |
% |
|
|
33 |
% |
Research, development and engineering |
|
|
7 |
% |
|
|
5 |
% |
Restructuring charges |
|
|
— |
% |
|
|
— |
% |
Operating income (loss) |
|
|
5 |
% |
|
|
(1 |
%) |
Loss on sale of subsidiary |
|
|
— |
% |
|
|
(4 |
%) |
Interest expense and other, net |
|
|
(1 |
%) |
|
|
— |
% |
Income (loss) from continuing operations before |
|
|
4 |
% |
|
|
(5 |
%) |
Income tax provision |
|
|
2 |
% |
|
|
1 |
% |
Income (loss) from continuing operations, net of |
|
|
2 |
% |
|
|
(6 |
%) |
Loss from discontinued operations, net of tax |
|
|
— |
% |
|
|
(18 |
)% |
Net income (loss) |
|
|
2 |
% |
|
|
(24 |
%) |
Fiscal 2021 compared to Fiscal 2020
Net Revenue
Net revenue consists of revenue recognized upon shipment and/or installation of equipment, with the exception of products using new technology, for which revenue is recognized upon customer acceptance. Spare parts sales are recognized upon shipment and service revenue is recognized upon completion of the service activity, which is generally ratable over the term of the service contract. Since the majority of our revenue is generated from large system sales, revenue and operating income can be significantly impacted by the timing of system shipments and system acceptances. See “Critical Accounting Policies – Revenue Recognition” included in “Item 7. Management’s Discussion and Analysis of Financial Condition and Results of Operations."
Our net revenue by operating segment for the years ended September 30, 2021 and 2020 were as follows (dollars in thousands):
|
|
Years Ended September 30, |
|
|
Increase |
|
|
|
|
|||||||
Segment |
|
2021 |
|
|
2020 |
|
|
(Decrease) |
|
|
% Change |
|
||||
Semiconductor |
|
$ |
72,086 |
|
|
$ |
54,516 |
|
|
$ |
17,570 |
|
|
|
32 |
% |
Material and Substrate |
|
|
13,119 |
|
|
|
10,304 |
|
|
|
2,815 |
|
|
|
27 |
% |
Non-segment related |
|
|
— |
|
|
|
643 |
|
|
|
(643 |
) |
|
|
(100 |
)% |
Total net revenue |
|
$ |
85,205 |
|
|
$ |
65,463 |
|
|
$ |
19,742 |
|
|
|
30 |
% |
Net revenue for the years ended September 30, 2021 and 2020 were $85.2 million and $65.5 million, respectively, an increase of $19.7 million or 30%. Revenue from the Semiconductor segment increased $17.6 million, or 32%. Our semiconductor segment revenues are dependent on our customers’ expansions, and our 2020 results were negatively impacted by the uncertainty in the global economy due primarily to the impact of the COVID-19 virus, as well as lingering trade tensions between the U.S. and China. The 2021 increase is primarily attributable to higher shipments across our reflow and diffusion furnace product lines in the 2021 period. Revenue from our Material and Substrate segment increased $2.8 million, or 27%, due primarily to the addition of Intersurface Dynamics in March 2021. Excluding Intersurface Dynamics' revenue, Material and Substrate revenue increased approximately 15% due to higher sales of both machines and consumables in the 2021 period. Non-segment related revenues relate to R2D, the Automation segment that we divested in December 2019.
37
Backlog and Orders
Our backlog, including deferred revenue, if any, as of September 30, 2021 and 2020 was as follows (dollars in thousands):
Segment |
|
September 30, |
|
|
September 30, |
|
|
Increase |
|
|
% Change |
|
||||
Semiconductor |
|
$ |
42,743 |
|
|
$ |
12,842 |
|
|
$ |
29,901 |
|
|
|
233 |
% |
Material and Substrate |
|
|
1,400 |
|
|
|
1,063 |
|
|
|
337 |
|
|
|
32 |
% |
Total backlog |
|
$ |
44,143 |
|
|
$ |
13,905 |
|
|
$ |
30,238 |
|
|
|
217 |
% |
For comparison purposes, we have removed the Automation segment, which we divested in December 2019, from the table below. New orders booked in the years ended September 30, 2021 and 2020 were as follows (dollars in thousands):
|
|
Years Ended September 30, |
|
|
Increase |
|
|
|
|
|||||||
Segment |
|
2021 |
|
|
2020 |
|
|
(Decrease) |
|
|
% Change |
|
||||
Semiconductor |
|
$ |
101,988 |
|
|
$ |
52,448 |
|
|
$ |
49,540 |
|
|
|
94 |
% |
Material and Substrate |
|
|
13,456 |
|
|
|
10,400 |
|
|
|
3,056 |
|
|
|
29 |
% |
Total new orders |
|
$ |
115,444 |
|
|
$ |
62,848 |
|
|
$ |
52,596 |
|
|
|
84 |
% |
At the end of 2021, two customers individually accounted for 25% and 17% of our total backlog. The orders included in our backlog are generally credit approved customer purchase orders believed to be firm and are expected to ship within the next twelve months. Because our orders are typically subject to cancellation or delay by the customer, our backlog at any particular point in time is not necessarily representative of actual sales for succeeding periods, nor is backlog any assurance that we will realize profit from completing these orders.
Gross Profit and Gross Margin
Gross profit is the difference between net revenue and cost of goods sold. Cost of goods sold consists of purchased material, labor and overhead to manufacture equipment or spare parts and the cost of service and support to customers for installation, warranty and paid service calls. Gross margin is gross profit as a percent of net revenue. Our gross profit and gross margin by operating segment for the years ended September 30, 2021 and 2020 were as follows (dollars in thousands):
|
|
Years Ended September 30, |
|
|
|
|
|
|
|
|||||||||||||||
Segment |
|
2021 |
|
|
Gross |
|
|
2020 |
|
|
Gross |
|
|
Incr |
|
|
% Change |
|
||||||
Semiconductor |
|
$ |
30,336 |
|
|
|
42 |
% |
|
$ |
21,199 |
|
|
|
39 |
% |
|
$ |
9,137 |
|
|
|
43 |
% |
Material and Substrate |
|
|
4,194 |
|
|
|
32 |
% |
|
|
3,233 |
|
|
|
31 |
% |
|
|
961 |
|
|
|
30 |
% |
Non-segment related |
|
|
— |
|
|
|
|
|
|
9 |
|
|
|
1 |
% |
|
|
(9 |
) |
|
|
(100 |
)% |
|
Total gross profit |
|
$ |
34,530 |
|
|
|
41 |
% |
|
$ |
24,441 |
|
|
|
37 |
% |
|
$ |
10,089 |
|
|
|
41 |
% |
Gross profit for the years ended September 30, 2021 and 2020 was $34.5 million and $24.4 million, respectively, representing an increase of $10.1 million, or 41%. Gross margin for 2021 and 2020 was 41% and 37%, respectively. Gross margin for the Semiconductor segment increased to 42% in 2021, compared to 39% in 2020, due primarily to a favorable product mix, lower labor costs as a portion of our engineers finished customer-specific design projects and began work on strategic-development projects, and a benefit from the usage of previously reserved inventory. In the Material and Substrate segment, gross margin increased slightly to 32% in 2021, compared to 31% in 2020 due primarily to the addition of Intersurface Dynamics as well as higher machine sales leading to improved utilization, partially offset by higher depreciation and inventory reserve charges.
38
Selling, General and Administrative Expenses
SG&A expenses consist of the cost of employees, consultants and contractors, facility costs, sales commissions, shipping costs, promotional marketing expenses, legal and accounting expenses and bad debt expense.
Total SG&A expenses for the years ended September 30, 2021 and 2020 were $24.7 million and $21.4 million, respectively. In 2021, SG&A increased by $3.3 million compared to the prior year. This increase was primarily due to increased commission expense of $1.5 million as a result of higher sales, costs associated with the data incident in April 2021 of $0.8 million, net of insurance reimbursements, and $0.8 million of costs incurred by Intersurface Dynamics during 2021. During the fourth quarter of 2021, we filed an insurance claim related to the data incident. There is no guarantee that we will be fully reimbursed for all expenses incurred. SG&A expense includes $0.4 million and $0.3 million of non-cash stock-based compensation expense for 2021 and 2020, respectively. Additionally, the fiscal 2020 period included a benefit of $0.3 million from payroll tax credits that were part of the CARES Act.
Research, Development and Engineering
RD&E expenses consist of the cost of employees, consultants and contractors who design, engineer and develop new products and processes as well as materials and supplies used in producing prototypes. RD&E expenses may vary from period to period depending on the engineering projects in process. Expenses related to engineers working on strategic projects or sustaining engineering projects are recorded in RD&E. However, from time to time we add functionality to our products or develop new products during engineering and manufacturing to fulfill specifications in a customer’s order, in which case the cost of development, along with other costs of the order, are charged to cost of goods sold. Occasionally, we receive reimbursements through governmental research and development grants which are netted against these expenses when certain conditions have been met.
RD&E expense, net of grants earned, for the years ended September 30, 2021 and 2020 were $6.0 million and $3.3 million, respectively, an increase of $2.7 million. This increase is due to increased labor expense related to a portion of our engineers as they completed customer-specific design projects and began work on strategic-development projects. We expect most of these strategic projects to be completed during fiscal 2022, resulting in new or updated product offerings in fiscal 2022. Grants earned are immaterial in all periods presented.
Restructuring Charges
We recorded restructuring charges of $0.1 million in 2021. These one-time charges relate to staff reductions in our Semiconductor and Material and Substrate operations. We recorded restructuring charges of $0.2 million in 2020. These one-time charges were the result of staff reductions at our Massachusetts operations as we evaluated staffing across our Semiconductor operations.
Income Taxes
Our effective tax rate at our continuing operations was 56.1% and (25.4)% in fiscal 2021 and 2020, respectively. The effective tax rate is the ratio of total income tax expense to pre-tax income. The effective tax rates for 2021 and 2020 were higher and lower than the U.S. statutory rate, respectively, due primarily to higher taxes on income in foreign jurisdictions as well as state income taxes in 2021 and 2020.
In 2021 and 2020, we recorded income tax expense at our continuing operations of $1.9 million and $0.8 million, respectively. In 2020, we recorded income tax benefit of $47,000 in our discontinued operations. The income tax provisions are based upon estimates of annual income, annual permanent differences and statutory tax rates in the various jurisdictions in which we operate, except that certain loss jurisdictions and discrete items are treated separately.
Generally accepted accounting principles require that a valuation allowance be established when it is “more likely than not” that all or a portion of deferred tax assets will not be realized. A review of all available positive and negative evidence needs to be considered, including a company’s performance, the market environment in which the Company operates and the length of carryback and carryforward periods. According to those principles, it is difficult to conclude that a valuation allowance is not needed when the negative evidence includes cumulative losses in recent years. We have concluded that we will maintain a full valuation allowance for all net deferred tax assets related to the
39
carryforwards of U.S. net operating losses and foreign tax credits. We will continue to monitor our cumulative income and loss positions in the U.S. and foreign jurisdictions to determine whether full valuation allowances on net deferred tax assets are appropriate. We expect to pay minimal U.S federal cash taxes for the foreseeable future as a result of our U.S. net operating losses.
Our future effective income tax rate depends on various factors, such as the amount of income (loss) in each tax jurisdiction, tax regulations governing each region, non-tax deductible expenses incurred as a percent of pre-tax income and the effectiveness of our tax planning strategies.
Liquidity and Capital Resources
Liquidity and Capital Allocation
We maintain a strong focus on liquidity and define our liquidity risk tolerance based on sources and uses to maintain a sufficient liquidity position to meet our obligations through our industry cycles, under both normal and stressed conditions. We manage our liquidity to provide access to sufficient funding to meet our business needs and financial obligations throughout business cycles. We operate in the semiconductor capital equipment industry, which is cyclical, and we must ensure we have sufficient liquidity during the down cycles and varying macroeconomic conditions. Our liquidity plans are established within the context of our financial and strategic planning processes and consider the liquidity necessary to fund our operating commitments, which include purchase obligations for inventory and equipment, payroll and general expenses. We also take into consideration our capital allocation and growth objectives, including investing in research and development, capital expenditures (including capacity assessments and IT systems) and debt payments.
See information below regarding payments we expect to make as a result of contractual obligations. We have never paid dividends on our common stock. Our present policy is to apply cash to investments in product development and upgrades, acquisitions or expansion; consequently, we do not expect to pay dividends on common stock in the foreseeable future. However, once the above priorities have been met, we will evaluate the returning of capital to shareholders, as we have done in the past.
The success of our growth strategy is dependent upon the availability of additional capital resources on terms satisfactory to management. Our sources of capital in the past have included the sale of equity securities, which includes common stock sold in private transactions and public offerings, and cash generated from operations. There can be no assurance that we can raise such additional capital resources when needed or on satisfactory terms. We believe that our principal sources of liquidity discussed above are sufficient to support operations for at least the next twelve months.
Cash and Cash Flow
The following table sets forth for the periods presented certain consolidated cash flow information (in thousands):
|
|
Years Ended September 30, |
|
|||||||||
|
|
2021 |
|
|
2020 |
|
|
2019 |
|
|||
Net cash (used in) provided by operating activities |
|
$ |
(5,962 |
) |
|
$ |
(1,664 |
) |
|
$ |
173 |
|
Net cash used in investing activities |
|
$ |
(8,094 |
) |
|
$ |
(12,616 |
) |
|
$ |
(1,826 |
) |
Net cash provided by (used in) financing activities |
|
$ |
1,166 |
|
|
$ |
(1,502 |
) |
|
$ |
(157 |
) |
Effect of exchange rate changes on cash |
|
$ |
656 |
|
|
$ |
1,718 |
|
|
$ |
(1,552 |
) |
Net decrease in cash, cash equivalents and restricted |
|
$ |
(12,234 |
) |
|
$ |
(14,064 |
) |
|
$ |
(3,362 |
) |
Cash, cash equivalents and restricted cash, beginning of year* |
|
$ |
45,070 |
|
|
$ |
59,134 |
|
|
$ |
62,496 |
|
Cash, cash equivalents and restricted cash, end of year* |
|
$ |
32,836 |
|
|
$ |
45,070 |
|
|
$ |
59,134 |
|
* Includes Cash, Cash Equivalents and Restricted Cash that are included in Held-For-Sale Assets on the Consolidated Balance Sheets for periods prior to January 22, 2020.
40
As of September 30, 2021 and 2020, cash and cash equivalents were $32.8 million and $45.1 million, respectively. We had no restricted cash at September 30, 2021 and 2020. Our working capital was $65.8 million as of September 30, 2021 and $69.1 million as of September 30, 2020. Our ratio of current assets to current liabilities was 5.4:1 as of September 30, 2021, and 10.2:1 as of September 30, 2020.
During periods of weakening demand, we typically generate cash from operating activities. Conversely, we are more likely to use operating cash flows for working capital requirements during periods of higher growth. The $12.2 million decrease in consolidated cash during 2021 was primarily due to cash paid for the acquisition of Intersurface Dynamics, net of cash acquired, of $5.1 million and capital expenditures of $3.0 million, partially offset by proceeds received from the exercise of stock options of $1.5 million. We maintain cash accounts denominated in currencies other than our reporting currency, which expose us to foreign exchange rate fluctuations.
Cash Flows from Operating Activities
Cash used in operating activities was $6.0 million in 2021 compared to cash used in operating activities of $1.7 million in 2020 and cash provided by operating activities of $0.2 million in 2019. During 2021, we increased our inventory balances in preparation for shipments scheduled for the first half of fiscal 2022. Additionally, our accounts receivable increased during this period as most of our shipments occurred late in the fourth quarter and our customers generally have payment terms of 60-90 days. During 2020, we increased our inventory balances to mitigate risks in our supply chain resulting from the COVID-19 pandemic, as well as in preparation for a large shipment that occurred in the first quarter of fiscal 2021.
Cash Flows from Investing Activities
Cash used in investing activities was $8.1 million in 2021, primarily consisting of $5.1 million net cash paid for the acquisition of Intersurface Dynamics and capital expenditures primarily related to the relocation of our Shanghai manufacturing facility. Cash used in investing activities was $12.6 million in 2020, primarily related to the divestiture of our solar businesses and capital expenditures for our new Material and Substrate building in Pennsylvania. Cash used in investing activities was $1.8 million in 2019, primarily related to the sale of SoLayTec. Investing activities in 2021, 2020 and 2019 included capital expenditures of $3.0 million, $2.7 million and $0.7 million, respectively.
Cash Flows from Financing Activities
In 2021, cash provided by financing activities was $1.2 million, consisting of approximately $1.5 million of proceeds received from the exercise of stock options, partially offset by payments on long-term debt of $0.4 million. In 2020, cash used in financing activities was $1.5 million, consisting of $0.9 million of proceeds received from the exercise of stock options, which was fully offset by $2.0 million used for stock repurchases and payments on long-term debt of $0.4 million. In 2019, cash used in financing activities was $0.2 million, consisting of $0.2 million in proceeds from the exercise of stock options offset by payments on long-term debt of $0.4 million.
Off-Balance Sheet Arrangements
As of September 30, 2021, we had no off-balance sheet arrangements as defined in Item 303(a)(4) of Regulation S-K promulgated by the SEC that have or are reasonably likely to have a current or future effect on financial condition, changes in financial condition, revenues or expenses, results of operations, liquidity, capital expenditures or capital resources that are material to investors.
41
Contractual Obligations and Commercial Commitments
We had the following contractual obligations and commercial commitments as of September 30, 2021, in thousands:
Contractual obligations |
|
Total |
|
|
Less than |
|
|
1-3 years |
|
|
3-5 years |
|
|
More than |
|
|||||
Debt obligations |
|
$ |
4,798 |
|
|
$ |
396 |
|
|
$ |
4,402 |
|
|
$ |
— |
|
|
$ |
— |
|
Lease obligations: |
|
|
|
|
|
|
|
|
|
|
|
|
|
|
|
|||||
Buildings |
|
|
13,848 |
|
|
|
1,029 |
|
|
|
2,066 |
|
|
|
1,928 |
|
|
|
8,825 |
|
Office equipment |
|
|
193 |
|
|
|
71 |
|
|
|
122 |
|
|
|
— |
|
|
|
— |
|
Vehicles |
|
|
42 |
|
|
|
26 |
|
|
|
16 |
|
|
|
— |
|
|
|
— |
|
Total operating lease obligations |
|
|
14,083 |
|
|
|
1,126 |
|
|
|
2,204 |
|
|
|
1,928 |
|
|
|
8,825 |
|
Purchase obligations |
|
|
17,039 |
|
|
|
17,039 |
|
|
|
— |
|
|
|
— |
|
|
|
— |
|
Total |
|
$ |
35,920 |
|
|
$ |
18,561 |
|
|
$ |
6,606 |
|
|
$ |
1,928 |
|
|
$ |
8,825 |
|
Acquisitions
Our business strategy includes the possible acquisition of or investments in other businesses to expand or complement our operations. The magnitude, timing and nature of any future acquisitions or investments will depend on a number of factors, including the availability of suitable candidates, the negotiation of acceptable terms, our financial capabilities and general economic and business conditions. Financing for future transactions would result in the utilization of cash, incurrence of additional debt, issuance of stock or some combination of the foregoing.
Critical Accounting Policies
See “Item 7. Management’s Discussion and Analysis of Financial Condition and Results of Operations” for a discussion of our consolidated financial statements that have been prepared in accordance with accounting principles generally accepted in the United States of America. The preparation of these consolidated financial statements requires us to make estimates and assumptions that affect the reported amount of assets and liabilities at the date of the consolidated financial statements, the disclosure of contingent assets and liabilities at the date of the consolidated financial statements and the reported amounts of revenue and expenses during the reporting period.
On an on-going basis, we evaluate our estimates and judgments, including those related to revenue recognition, income taxes, inventory valuation and inventory purchase commitments, and indefinite-lived assets. We base our estimates and judgments on historical experience, expectations regarding the future and on various other factors that we believe to be reasonable under the circumstances. The results of these estimates and judgments form the basis for making conclusions about the carrying value of assets and liabilities that are not readily apparent from other sources. Actual results may differ from these estimates under different assumptions or conditions.
A critical accounting policy is one that is both important to the presentation of our financial position and results of operations, and requires management’s most difficult, subjective or complex judgments, often as a result of the need to make estimates about the effect of matters that are inherently uncertain. These uncertainties are discussed in “Item 1A. Risk Factors.” We believe the following critical accounting policies encompass the more significant judgments and estimates used in the preparation of our consolidated financial statements.
42
Revenue Recognition. We recognize revenue when a customer obtains control of promised goods or services in an amount that reflects the consideration expected to be received in exchange for those goods or services. A performance obligation is a promise in a contract to transfer a product or service to the customer. The transaction price of a contract is allocated to each distinct performance obligation based upon the relative standalone selling price ("SSP") for each performance obligation and is recognized as revenue upon satisfaction of the performance obligation. To record revenue properly, we apply the following five steps:
1) Identify the contract with the customer
A contract with a customer exists when (i) we enter into an enforceable contract with a customer that defines each party’s rights regarding the goods or services to be transferred and identifies the related payment terms, (ii) the contract has commercial substance, and (iii) we determine that collection of substantially all consideration for goods and services that are transferred is probable based on the customer’s intent and ability to pay the promised consideration.
2) Identify the performance obligations in the contract
Performance obligations are identified based on the goods and services that will be transferred to the customer that are both (i) capable of being distinct, whereby the customer can benefit from the good or service either on its own or together with other available resources, and (ii) are distinct in the context of the contract, whereby the transfer of the good or service is separately identifiable from other promises to the customer in the contract. To the extent a contract includes multiple promised goods and services, we must apply judgment to determine whether promised goods and services are capable of being distinct and distinct in the context of the contract. If these criteria are not met, the promised goods and services are accounted for as a combined performance obligation.
Our equipment sales consist of multiple performance obligations, including the delivery of the system itself and obligations that are not delivered simultaneously with the system, such as installation services and training. In most cases, these services require minimal effort and are perfunctory in nature. Therefore, equipment and related services are treated as one performance obligation. Customers who purchase new systems are provided an assurance-type warranty, generally for periods of 12 to 24 months. Assurance-type warranties are not considered a performance obligation.
3) Determine the transaction price
The transaction price is determined based on the consideration to which we will be entitled in exchange for transferring goods and services to the customer. The transaction price for equipment sales is adjusted for estimated product returns that we expect to occur under our return policy based upon past return rates, which have historically been immaterial. In rare cases when the transaction price includes variable consideration, we estimate the amount of variable consideration that should be included in the transaction price utilizing either the expected value method or the most likely amount method, depending on the nature of the variable consideration. Any estimates, including the effect of the constraint on variable consideration, are evaluated at each reporting period for any changes.
The transaction price is based on the price reflected in the individual customer’s purchase order. Variable consideration has not been identified as a significant component of the transaction price for any of our existing contracts.
4) Allocate the transaction price to performance obligations in the contract
If the contract contains a single performance obligation, the entire transaction price is allocated to the single performance obligation. Contracts that contain multiple distinct performance obligations require an allocation of the transaction price to each distinct performance obligation. In rare cases, the transaction price is variable and meets criteria to be allocated entirely to each distinct performance obligation or to a distinct service that forms part of a single performance obligation.
When required, we determine the SSP for each performance obligation based on consideration of both market and company-specific factors, including the selling price and profit margin for similar products. For those contracts
43
that contain multiple performance obligations (primarily system sales requiring extensive installation services), we must determine the SSP for each performance obligation. To determine the SSP for labor related performance obligations (such as the labor component of installation), we use directly observable inputs based on the standalone sale prices for these services. We use a cost-plus margin approach in determining the SSP for any materials-related performance obligations (e.g., system add-ons, spare parts, and systems).
5) Recognize revenue when, or as, we satisfy a performance obligation
We satisfy performance obligations either over time or at a point in time. Revenue is recognized over time if either (i) the customer simultaneously receives and consumes the benefits provided by our performance, (ii) our performance creates or enhances an asset that the customer controls as the asset is created or enhanced, or (iii) our performance does not create an asset with an alternative use to the entity and we have an enforceable right to payment for performance completed to date. If we do not satisfy a performance obligation over time, the related performance obligation is satisfied at a point in time by transferring the control of a promised good or service to a customer. Examples of control are using the asset to produce goods or services, enhance the value of other assets, settle liabilities, and holding or selling the asset. For over time recognition, we are required to select a single revenue recognition method for the performance obligation that faithfully depicts our performance in transferring control of the goods and services. We can choose between two methods to measure progress toward complete satisfaction of a performance obligation:
Output methods – recognize revenue on the basis of direct measurements of the value to the customer of the goods or services transferred to date relative to the remaining goods or services promised under the contract (e.g., surveys of performance completed to date, appraisals of results achieved, milestones reached, time elapsed, and units of produced or units delivered); or
Input methods – recognize revenue on the basis of our efforts or inputs to the satisfaction of a performance obligation (e.g., resources consumed, labor hours expended, costs incurred, or time elapsed) relative to the total expected inputs to the satisfaction of that performance obligation.
Equipment and related product revenues (e.g., furnace systems, system add-ons, machinery, consumables and spare parts) are recognized at a point in time, when they are shipped or delivered, depending on contractual terms. For products where the customer’s defined specifications have not been met with respect to at least two similarly configured systems and processes (i.e., new technology), the revenue and directly-related costs are deferred at the time of shipment and later recognized at the time of customer acceptance or when this criterion has been met.
For installation services related to our current products, revenue is recognized at a point in time, when the equipment is shipped or delivered, depending on contractual terms. The nature of the installation services requires minimal effort and is perfunctory in nature. Therefore, delivery of equipment and any related installation are treated as one performance obligation. Our installation obligations related to future products may differ, thus requiring treatment as a separate performance obligation.
Revenue for maintenance and service contracts are recognized over time. Progress in the satisfaction of these performance obligations will be measured using an input method of either time elapsed, in the case of fixed-period contracts, or labor hours expended, in the case of project-based contracts.
We exclude from the transaction price all sales taxes that are assessed by a governmental authority and that are imposed on and concurrent with a specific revenue-producing transaction and collected from a customer (for example, sales, use, value added, and some excise taxes). Sales taxes are presented on a net basis (excluded from revenues) in our Consolidated Statements of Operations. Our remaining performance obligations as of September 30, 2021, have an original duration of one year or less. We do not have any payment terms that exceed one year from the point we have satisfied the related performance obligations.
Income Taxes. The calculation of tax liabilities involves significant judgment in identifying uncertain tax positions and estimating the amount of deferred tax assets that will be realized in the future and the impact of uncertainties in the application of complex tax laws. Resolution of these uncertainties in a manner inconsistent with our expectations could have a material impact on our operations and financial condition.
44
We are required to apply a more-likely-than-not threshold to the recognition and derecognition of uncertain tax positions and in determining whether certain tax benefits will be realized in the future. We are required to recognize the amount of tax benefit that has a greater than 50 percent likelihood of being ultimately realized upon settlement. It further requires that a change in judgment related to the expected ultimate resolution of uncertain tax positions be recognized in earnings in the period of such change.
We record a valuation allowance to reduce our deferred tax assets to the amount that is more likely than not to be realized. We consider past operating results, future market growth, historical and projected taxable income, the mix of earnings in the jurisdictions in which we operate, prudent and feasible tax planning strategies and statutory tax law changes in determining the need for a valuation allowance. If we were to determine that it is more likely than not that we would not be able to realize all or part of our net deferred tax assets in the future, an adjustment to the deferred tax assets would be charged to earnings in the period such determination is made. Likewise, if we later determine that it is more likely than not that all or part of the net deferred tax assets would be realized, then all or part of the previously provided valuation allowance would be reversed. As of September 30, 2021, we have significant U.S. deferred tax assets that have a full valuation allowance. Any changes to the judgements related to our valuation allowance could have a material impact on our results of operations.
Inventory Valuation and Inventory Purchase Commitments. We value our inventory at the lower of cost or net realizable value. Inventory cost includes the purchase price of parts or finished good and any freight cost incurred to receive the inventory into our manufacturing facilities. We regularly review inventory quantities and record a write-down to net realizable value for excess and obsolete inventory. The write-down is primarily based on historical inventory usage adjusted for expected changes in product demand and production requirements. Our industry is characterized by customers in highly-cyclical industries, rapid technological changes, frequent new product developments and rapid product obsolescence. Changes in demand for our products could result in further write-downs.
We must order components for our products and build inventory in advance of product shipments through issuance of purchase orders based on projected demand. These commitments typically cover our requirements for periods ranging from 30 to 180 days or longer when there is a significant increase in demand or lead-times from suppliers. These purchase commitments may result in accepting delivery of components not needed to meet current demand. We accrue for estimated cancellation fees related to component orders that have been cancelled or are expected to be cancelled, and for excess inventories that will likely result in our taking delivery of ordered inventory items in excess of our projected needs. If there is an abrupt and substantial decline in demand for one or more of our products, an unanticipated change in technological requirements for any of our products, or a change in our suppliers’ practice of not enforcing purchase commitments, we may be required to record additional charges for these items. This would negatively impact gross margin in the period when the charges are recorded.
Indefinite-Lived Assets and Goodwill. We perform an annual impairment test in the fourth quarter of each year, or more frequently if indicators of potential impairment exist, to determine whether the fair value of a reporting unit in which goodwill resides is less than its carrying value. We perform the first step of the goodwill impairment test, which compares the fair value of the reporting unit to its carrying value. If the fair value of the reporting unit exceeds the carrying value of the net assets assigned to that unit, goodwill is not considered impaired and we are not required to perform additional analysis. If the carrying value of the net assets assigned to the reporting unit exceeds the fair value of the reporting unit, we would recognize an impairment charge for the amount by which the carrying amount exceeds the reporting unit’s fair value (although the loss would not exceed the total amount of goodwill allocated to the reporting unit).
Determining the fair value of a reporting unit involves the use of significant estimates and assumptions. Our goodwill impairment test uses a weighting of the income approach and the market approach to estimate a reporting unit’s fair value. The income approach is based on a discounted future cash flow analysis that uses certain assumptions including: projections of revenues and expenses and related cash flows based on assumed long-term growth rates and demand trends; expected future investments and working capital requirements to sustain and grow the business; and estimated discount rates based on the reporting unit’s weighted average cost of capital as derived by the Capital Asset Pricing Model (CAPM) and other methods, which includes observable market inputs and other data from identified comparable companies. The same estimates are also used internally for our capital budgeting process, and for
45
long-term and short-term business planning and forecasting. We test the reasonableness of the inputs and outcomes of our discounted cash flow analysis against available comparable market data.
The market approach is based on the application of appropriate market-derived multiples selected from (i) comparable publicly-traded companies and/or (ii) the implied transaction multiples derived from identified merger and acquisition activity in the market. Multiples are then selected based on a comparison of the reviewed data to that of the reporting unit and applied to relevant historical and forecasted financial parameters such as levels of revenues, EBITDA, EBIT or other metrics.
If actual results differ significantly from our projections, we may be required to record a material impairment charge.
Impact of Recently Issued Accounting Pronouncements
For discussion of recently issued accounting pronouncements, see “Recently Issued Accounting Pronouncements” within "Note 1. Summary of Operations and Significant Accounting Policies” in “Item 8. Financial Statements and Supplementary Data.”
ITEM 7A. QUANTITATIVE AND QUALITATIVE DISCLOSURES ABOUT MARKET RISK
As a smaller reporting company, as defined by Rule 12b-2 of the Exchange Act and in Item 10(f)(1) of Regulation S-K, we are electing scaled disclosure reporting obligations and, therefore, are not required to provide the information requested by this Item.
ITEM 8. FINANCIAL STATEMENTS AND SUPPLEMENTARY DATA
The following documents are filed as part of this Annual Report on Form 10-K:
46
REPORT OF INDEPENDENT REGISTERED PUBLIC ACCOUNTING FIRM
To the Board of Directors and
Shareholders of:
AMTECH SYSTEMS, INC. AND SUBSIDIARIES
Opinion on the Consolidated Financial Statements
We have audited the accompanying consolidated balance sheets of Amtech Systems, Inc. and Subsidiaries (the Company) as of September 30, 2021 and 2020, and the related consolidated statements of operations, comprehensive income (loss), shareholders’ equity, and cash flows for each of the years in the three-year period ended September 30, 2021, and the related notes (collectively referred to as the consolidated financial statements). In our opinion, the consolidated financial statements present fairly, in all material respects, the financial position of the Company as of September 30, 2021 and 2020, and the results of its operations and its cash flows for each of the years in the three-year period ended September 30, 2021, in conformity with accounting principles generally accepted in the United States of America.
Basis for Opinion
These consolidated financial statements are the responsibility of the Company’s management. Our responsibility is to express an opinion on the Company’s consolidated financial statements based on our audits. We are a public accounting firm registered with the PCAOB and are required to be independent with respect to the Company in accordance with the U.S. federal securities laws and the applicable rules and regulations of the Securities and Exchange Commission and the PCAOB.
We conducted our audits in accordance with the standards of the PCAOB. Those standards require that we plan and perform the audits to obtain reasonable assurance about whether the financial statements are free of material misstatement, whether due to error or fraud. Our audits included performing procedures to assess the risks of material misstatement of the financial statements, whether due to error or fraud, and performing procedures that respond to those risks. Such procedures included examining, on a test basis, evidence regarding the amounts and disclosures in the financial statements. Our audits also included evaluating the accounting principles used and significant estimates made by management, as well as evaluating the overall presentation of the consolidated financial statements. We believe that our audits provide a reasonable basis for our opinion.
Critical Audit Matter
The critical audit matter communicated below is a matter arising from the current period audit of the financial statements that was communicated or required to be communicated to the audit committee and that (i) relates to accounts or disclosures that are material to the financial statements and (ii) involved our especially challenging, subjective, or complex judgments. The communication of critical audit matters does not alter in any way our opinion on the consolidated financial statements, taken as a whole, and we are not, by communicating the critical audit matter below, providing a separate opinion on the critical audit matter or on the accounts or disclosures to which it relates.
Accounting for Income Taxes in Foreign Jurisdictions
As described in Note 11 to the consolidated financial statements, the Company is subject to income taxes in the United States, as well as China and a number of other foreign jurisdictions. The application of tax laws to the Company’s operations can be complex and subject to different interpretations by the Company and respective governmental taxing authorities. The Company exercises judgment for the interpretation of current tax regulations. We identified the auditing of the accounting for income taxes as a critical audit matter.
The principal consideration for our determination that the auditing of income taxes was a critical audit matter was the complex auditor judgment required when evaluating the foreign income tax provisions and use of specialized knowledge and experience necessary in evaluating the completeness of the foreign tax provisions and uncertain tax
47
positions primarily due to the Company’s multinational presence in numerous foreign jurisdictions with varying complexity in tax laws and regulations.
The primary procedures we performed to address this critical audit matter included:
/s/ MAYER HOFFMAN MCCANN P.C. |
|
|
We have served as the Company's auditor since 2005. |
|
|
|
|
|
Phoenix, Arizona |
|
|
November 17, 2021 |
|
|
48
PART I. FINANCIAL INFORMATION
ITEM 1. Consolidated Financial Statements
AMTECH SYSTEMS, INC. AND SUBSIDIARIES
Consolidated Balance Sheets
(in thousands, except share and per share data)
Assets |
|
September 30, |
|
|
September 30, |
|
||
Current Assets |
|
|
|
|
|
|
||
Cash and cash equivalents |
|
$ |
|
|
$ |
|
||
Accounts receivable - Net |
|
|
|
|
|
|
||
Inventory - Net |
|
|
|
|
|
|
||
Income taxes receivable |
|
|
|
|
|
|
||
Other current assets |
|
|
|
|
|
|
||
Total current assets |
|
|
|
|
|
|
||
Property, Plant and Equipment - Net |
|
|
|
|
|
|
||
Right-of-Use Assets - Net |
|
|
|
|
|
|
||
Intangible Assets - Net |
|
|
|
|
|
|
||
Goodwill - Net |
|
|
|
|
|
|
||
Deferred Income Taxes - Net |
|
|
|
|
|
|
||
Other Assets |
|
|
|
|
|
|
||
Total Assets |
|
$ |
|
|
$ |
|
||
Liabilities and Shareholders’ Equity |
|
|
|
|
|
|
||
Current Liabilities |
|
|
|
|
|
|
||
Accounts payable |
|
$ |
|
|
$ |
|
||
Accrued compensation and related taxes |
|
|
|
|
|
|
||
Accrued warranty expense |
|
|
|
|
|
|
||
Other accrued liabilities |
|
|
|
|
|
|
||
Current maturities of long-term debt |
|
|
|
|
|
|
||
Current portion of long-term lease liability |
|
|
|
|
|
|
||
Contract liabilities |
|
|
|
|
|
|
||
Total current liabilities |
|
|
|
|
|
|
||
Long-Term Debt |
|
|
|
|
|
|
||
Long-Term Lease Liability |
|
|
|
|
|
|
||
Income Taxes Payable |
|
|
|
|
|
|
||
Other Long-Term Liabilities |
|
|
|
|
|
— |
|
|
Total Liabilities |
|
|
|
|
|
|
||
|
|
|
|
|
|
|||
Shareholders’ Equity |
|
|
|
|
|
|
||
; |
|
|
— |
|
|
|
— |
|
Common stock; $ |
|
|
|
|
|
|
||
Additional paid-in capital |
|
|
|
|
|
|
||
Accumulated other comprehensive income (loss) |
|
|
|
|
|
( |
) |
|
Retained deficit |
|
|
( |
) |
|
|
( |
) |
Total Shareholders’ Equity |
|
|
|
|
|
|
||
Total Liabilities and Shareholders’ Equity |
|
$ |
|
|
$ |
|
||
The accompanying notes are an integral part of these consolidated financial statements.
49
AMTECH SYSTEMS, INC. AND SUBSIDIARIES
Consolidated Statements of Operations
(in thousands, except per share data)
|
|
Years Ended September 30, |
|
|||||||||
|
|
2021 |
|
|
2020 |
|
|
2019 |
|
|||
Revenue, net of returns and allowances |
|
$ |
|
|
$ |
|
|
$ |
|
|||
Cost of sales |
|
|
|
|
|
|
|
|
|
|||
Gross profit |
|
|
|
|
|
|
|
|
|
|||
Selling, general and administrative |
|
|
|
|
|
|
|
|
|
|||
Research, development and engineering |
|
|
|
|
|
|
|
|
|
|||
Restructuring charges |
|
|
|
|
|
|
|
|
|
|||
Operating income (loss) |
|
|
|
|
|
( |
) |
|
|
|
||
Loss on sale of subsidiary |
|
|
|
|
|
( |
) |
|
|
|
||
Interest (expense) income and other, net |
|
|
( |
) |
|
|
|
|
|
|
||
Income (loss) from continuing operations before income taxes |
|
|
|
|
|
( |
) |
|
|
|
||
Income tax provision |
|
|
|
|
|
|
|
|
|
|||
Income (loss) from continuing operations, net of tax |
|
|
|
|
|
( |
) |
|
|
|
||
Loss from discontinued operations, net of tax |
|
|
— |
|
|
|
( |
) |
|
|
( |
) |
Net income (loss) |
|
$ |
|
|
$ |
( |
) |
|
$ |
( |
) |
|
Income (Loss) Per Basic Share: |
|
|
|
|
|
|
|
|
|
|||
Basic income (loss) per share from continuing operations |
|
$ |
|
|
$ |
( |
) |
|
$ |
|
||
Basic loss per share from discontinued operations |
|
$ |
— |
|
|
$ |
( |
) |
|
$ |
( |
) |
Net income (loss) per basic share |
|
$ |
|
|
$ |
( |
) |
|
$ |
( |
) |
|
Income (Loss) Per Diluted Share: |
|
|
|
|
|
|
|
|
|
|||
Diluted income (loss) per share from continuing operations |
|
$ |
|
|
$ |
( |
) |
|
$ |
|
||
Diluted loss per share from discontinued operations |
|
$ |
— |
|
|
$ |
( |
) |
|
$ |
( |
) |
Net income (loss) per diluted share |
|
$ |
|
|
$ |
( |
) |
|
$ |
( |
) |
|
|
|
|
|
|
|
|
|
|
|
|||
Weighted average shares outstanding - basic |
|
|
|
|
|
|
|
|
|
|||
Weighted average shares outstanding - diluted |
|
|
|
|
|
|
|
|
|
|||
The accompanying notes are an integral part of these consolidated financial statements.
50
AMTECH SYSTEMS, INC. AND SUBSIDIARIES
Consolidated Statements of Comprehensive Income (Loss)
(in thousands)
|
|
Years Ended September 30, |
|
|||||||||
|
|
2021 |
|
|
2020 |
|
|
2019 |
|
|||
Net income (loss) |
|
$ |
|
|
$ |
( |
) |
|
$ |
( |
) |
|
Foreign currency translation adjustment |
|
|
|
|
|
|
|
|
( |
) |
||
Reclassification adjustment for net foreign currency translation |
|
|
— |
|
|
|
|
|
|
|
||
Comprehensive income (loss) |
|
$ |
|
|
$ |
( |
) |
|
$ |
( |
) |
|
The accompanying notes are an integral part of these consolidated financial statements.
51
AMTECH SYSTEMS, INC. AND SUBSIDIARIES
(in thousands)
|
|
Common Stock |
|
|
Treasury Stock |
|
|
|
|
|
Accumulated |
|
|
|
|
|
|
|
||||||||||||||
|
|
|
|
|
|
|
|
|
|
|
|
|
|
Additional |
|
|
Other |
|
|
|
|
|
Total |
|
||||||||
|
|
|
|
|
Par |
|
|
|
|
|
|
|
|
Paid-in |
|
|
Comprehensive |
|
|
Retained |
|
|
Shareholders’ |
|
||||||||
|
|
Shares |
|
|
Value |
|
|
Shares |
|
|
Cost |
|
|
Capital |
|
|
Income (Loss) |
|
|
Deficit |
|
|
Equity |
|
||||||||
Balances at September 30, 2018 |
|
|
|
|
$ |
|
|
|
— |
|
|
$ |
— |
|
|
$ |
|
|
$ |
( |
) |
|
$ |
( |
) |
|
$ |
|
||||
Net loss |
|
|
— |
|
|
|
— |
|
|
|
— |
|
|
|
— |
|
|
|
— |
|
|
|
— |
|
|
|
( |
) |
|
|
( |
) |
Translation adjustment |
|
|
— |
|
|
|
— |
|
|
|
— |
|
|
|
— |
|
|
|
— |
|
|
|
( |
) |
|
|
— |
|
|
|
( |
) |
Stock compensation expense |
|
|
— |
|
|
|
— |
|
|
|
— |
|
|
|
— |
|
|
|
|
|
|
— |
|
|
|
— |
|
|
|
|
||
Stock options exercised |
|
|
|
|
|
|
|
|
— |
|
|
|
— |
|
|
|
|
|
|
— |
|
|
|
— |
|
|
|
|
||||
Balances at September 30, 2019 |
|
|
|
|
$ |
|
|
|
— |
|
|
$ |
— |
|
|
$ |
|
|
$ |
( |
) |
|
$ |
( |
) |
|
$ |
|
||||
Net loss |
|
|
— |
|
|
|
— |
|
|
|
— |
|
|
|
— |
|
|
|
— |
|
|
|
— |
|
|
|
( |
) |
|
|
( |
) |
Translation adjustment |
|
|
— |
|
|
|
— |
|
|
|
— |
|
|
|
— |
|
|
|
— |
|
|
|
|
|
|
— |
|
|
|
|
||
Stock compensation expense |
|
|
— |
|
|
|
— |
|
|
|
— |
|
|
|
— |
|
|
|
|
|
|
— |
|
|
|
— |
|
|
|
|
||
Repurchase of treasury stock |
|
|
— |
|
|
|
— |
|
|
|
( |
) |
|
|
( |
) |
|
|
— |
|
|
|
— |
|
|
|
— |
|
|
|
( |
) |
Retirement of treasury stock |
|
|
( |
) |
|
|
( |
) |
|
|
|
|
|
|
|
|
( |
) |
|
|
— |
|
|
|
( |
) |
|
|
— |
|
||
Stock options exercised |
|
|
|
|
|
|
|
|
— |
|
|
|
— |
|
|
|
|
|
|
— |
|
|
|
— |
|
|
|
|
||||
Balances at September 30, 2020 |
|
|
|
|
$ |
|
|
|
— |
|
|
$ |
— |
|
|
$ |
|
|
$ |
( |
) |
|
$ |
( |
) |
|
$ |
|
||||
Net income |
|
|
— |
|
|
|
— |
|
|
|
— |
|
|
|
— |
|
|
|
— |
|
|
|
— |
|
|
|
|
|
|
|
||
Translation adjustment |
|
|
— |
|
|
|
— |
|
|
|
— |
|
|
|
— |
|
|
|
— |
|
|
|
|
|
|
— |
|
|
|
|
||
Stock compensation expense |
|
|
— |
|
|
|
— |
|
|
|
— |
|
|
|
— |
|
|
|
|
|
|
— |
|
|
|
— |
|
|
|
|
||
Stock options exercised |
|
|
|
|
|
|
|
|
— |
|
|
|
— |
|
|
|
|
|
|
— |
|
|
|
— |
|
|
|
|
||||
Balances at September 30, 2021 |
|
|
|
|
$ |
|
|
|
— |
|
|
$ |
— |
|
|
$ |
|
|
$ |
|
|
$ |
( |
) |
|
$ |
|
|||||
The accompanying notes are an integral part of these consolidated financial statements.
52
AMTECH SYSTEMS, INC. AND SUBSIDIARIES
Consolidated Statements of Cash Flows
(in thousands)
|
|
Years Ended September 30, |
|
|||||||||
|
|
2021 |
|
|
2020 |
|
|
2019 |
|
|||
Operating Activities |
|
|
|
|
|
|
|
|
|
|||
Net income (loss) |
|
$ |
|
|
$ |
( |
) |
|
$ |
( |
) |
|
Adjustments to reconcile net income (loss) to net cash (used in) provided by |
|
|
|
|
|
|
|
|
|
|||
Depreciation and amortization |
|
|
|
|
|
|
|
|
|
|||
Write-down of inventory |
|
|
|
|
|
|
|
|
|
|||
Provision for allowance for doubtful accounts |
|
|
|
|
|
|
|
|
|
|||
Deferred income taxes |
|
|
( |
) |
|
|
|
|
|
|
||
Non-cash share-based compensation expense |
|
|
|
|
|
|
|
|
|
|||
Loss (gain) on sales of subsidiaries |
|
|
— |
|
|
|
|
|
|
( |
) |
|
Other, net |
|
|
|
|
|
|
|
|
|
|||
Changes in operating assets and liabilities: |
|
|
|
|
|
|
|
|
|
|||
Accounts receivable |
|
|
( |
) |
|
|
|
|
|
|
||
Inventory |
|
|
( |
) |
|
|
( |
) |
|
|
( |
) |
Contract and other assets |
|
|
( |
) |
|
|
|
|
|
|
||
Accounts payable |
|
|
|
|
|
( |
) |
|
|
( |
) |
|
Accrued income taxes |
|
|
|
|
|
( |
) |
|
|
( |
) |
|
Accrued and other liabilities |
|
|
|
|
|
|
|
|
( |
) |
||
Contract liabilities |
|
|
|
|
|
( |
) |
|
|
( |
) |
|
Net cash (used in) provided by operating activities |
|
|
( |
) |
|
|
( |
) |
|
|
|
|
Investing Activities |
|
|
|
|
|
|
|
|
|
|||
Purchases of property, plant and equipment |
|
|
( |
) |
|
|
( |
) |
|
|
( |
) |
Net cash disposed of in sales of subsidiaries |
|
|
— |
|
|
|
( |
) |
|
|
( |
) |
Acquisition, net of cash and cash equivalents acquired |
|
|
( |
) |
|
|
— |
|
|
|
— |
|
Net cash used in investing activities |
|
|
( |
) |
|
|
( |
) |
|
|
( |
) |
Financing Activities |
|
|
|
|
|
|
|
|
|
|||
Proceeds from the exercise of stock options |
|
|
|
|
|
|
|
|
|
|||
Repurchase of common stock |
|
|
— |
|
|
|
( |
) |
|
|
— |
|
Payments on long-term debt |
|
|
( |
) |
|
|
( |
) |
|
|
( |
) |
Borrowings on long-term debt |
|
|
— |
|
|
|
— |
|
|
|
|
|
Net cash provided by (used in) financing activities |
|
|
|
|
|
( |
) |
|
|
( |
) |
|
Effect of Exchange Rate Changes on Cash, Cash Equivalents and |
|
|
|
|
|
|
|
|
( |
) |
||
Net Decrease in Cash, Cash Equivalents and Restricted Cash |
|
|
( |
) |
|
|
( |
) |
|
|
( |
) |
Cash, Cash Equivalents and Restricted Cash, Beginning of Year* |
|
|
|
|
|
|
|
|
|
|||
Cash, Cash Equivalents and Restricted Cash, End of Year* |
|
$ |
|
|
$ |
|
|
$ |
|
|||
Supplemental Cash Flow Information: |
|
|
|
|
|
|
|
|
|
|||
Income tax (payments) refunds, net |
|
$ |
( |
) |
|
$ |
( |
) |
|
$ |
|
|
Interest paid, net of capitalized interest |
|
$ |
|
|
$ |
|
|
$ |
|
|||
Supplemental Non-cash Financing and Investing Activities: |
|
|
|
|
|
|
|
|
|
|||
Transfer of inventory to property, plant, and equipment |
|
$ |
|
|
$ |
|
|
$ |
— |
|
||
Leased assets obtained in exchange for new operating lease liabilities |
|
$ |
|
|
$ |
|
|
$ |
— |
|
||
Leased assets obtained in exchange for new finance lease liabilities |
|
$ |
|
|
$ |
— |
|
|
$ |
— |
|
|
Accrued for asset retirement obligation |
|
$ |
|
|
$ |
— |
|
|
$ |
— |
|
|
*
The accompanying notes are an integral part of these consolidated financial statements.
53
Notes to Consolidated Financial Statements
For the Years Ended September 30, 2021, 2020 and 2019
1. Summary of Operations and Significant Accounting Policies
Description of Business – Amtech is a leading, global manufacturer of capital equipment, including thermal processing and wafer polishing, and related consumables used in fabricating semiconductor devices, such as silicon carbide (SiC) and silicon power devices, analog and discrete devices, electronic assemblies and light-emitting diodes (LEDs). We sell these products to semiconductor device and module manufacturers worldwide, particularly in Asia, North America and Europe.
We serve niche markets in industries that are experiencing technological advances, and which historically have been very cyclical. Therefore, future profitability and growth depend on our ability to develop or acquire and market profitable new products and on our ability to adapt to cyclical trends.
Our fiscal year is from October 1 to September 30. Unless otherwise stated, references to the years 2021, 2020 and 2019 relate to the fiscal years ended September 30, 2021, 2020 and 2019, respectively.
In March 2020, the outbreak of COVID-19 was recognized as a pandemic by the World Health Organization, and the outbreak became increasingly widespread, including in all of the markets in which we operate. We continue to monitor the impact of COVID-19 on all aspects of our business. We are a company operating in a critical infrastructure industry, as defined by the U.S. Department of Homeland Security. Consistent with federal guidelines and with state and local orders to date, we have continued to operate across our footprint throughout the COVID-19 pandemic. Following the onset of COVID-19 and its negative effects on our business, most prominently reflected in our second, third and fourth quarter fiscal 2020 results, global economic conditions improved during fiscal 2021, resulting in increased demand for our products and services, which led to our earnings for fiscal 2021 substantially exceeding our fiscal 2020 results. There remain many unknowns and we continue to monitor the expected trends and related demand for our products and services and have and will continue to adjust our operations accordingly.
Use of Estimates – The preparation of consolidated financial statements in conformity with accounting principles generally accepted in the United States of America requires management to make estimates and assumptions that affect the reported amounts of assets and liabilities and disclosure of contingent assets and liabilities at the date of the consolidated financial statements and the reported amounts of revenue and expenses during the reporting period. Actual results could differ from those estimates.
Reclassifications – Certain reclassifications have been made to prior year financial statements to conform to the current year presentation. Results for all periods presented in this report have been reclassified for changes to our reportable segments (Note 17). These reclassifications had no effect on the previously reported consolidated financial statements for any period.
Divestitures – Significant accounting policies associated with a decision to dispose of a business are discussed below:
Discontinued Operations – A business is classified as discontinued operations if the disposal represents a strategic shift that will have a major effect on operations or financial results and meets the criteria to be classified as held for sale or is disposed of by sale or otherwise. Significant judgments are involved in determining whether a business meets the criteria for discontinued operations reporting and the period in which these criteria are met. If a business is reported as a discontinued operation, the results of operations through the date of sale, including any gain or loss recognized on the disposition, are presented on a separate line of the Consolidated Statement of Operations. Interest on debt directly attributable to the discontinued operation is allocated to discontinued operations.
Assets Held for Sale – An asset or business is classified as held for sale when (i) management commits to a plan to sell and it is actively marketed; (ii) it is available for immediate sale and the sale is expected to be completed within one year; and (iii) it is unlikely significant changes to the plan will be made or that the plan will be withdrawn. In
54
isolated instances, assets held for sale may exceed one year due to events or circumstances beyond our control. The assets and related liabilities are aggregated and reported on separate lines of the Consolidated Balance Sheets.
Cash and Cash Equivalents – We consider all highly liquid investments with a maturity of three months or less when purchased to be cash equivalents. Our cash and cash equivalents consist of amounts invested in U.S. money market funds and various U.S. and foreign bank operating and time deposit accounts.
We maintain our cash, cash equivalents and restricted cash in multiple financial institutions. Balances in the United States, which account for approximately
Restricted Cash – Restricted cash includes collateral for bank guarantees required by certain customers from whom deposits have been received in advance of shipment.
Accounts Receivable and Allowance for Doubtful Accounts – Accounts receivable are recorded at the sales price of products sold to customers on trade credit terms. Accounts receivable are considered past due when payment has not been received from the customer within the normal credit terms extended to that customer. A valuation allowance is established for accounts when collection is no longer probable. Accounts are written off against the allowance when the probability of collection is remote. Historically, these write-offs have been immaterial.
Inventory – We value our inventory at the lower of cost or net realizable value. Inventory cost includes the purchase price of parts or finished goods and any freight cost incurred to receive the inventory into our manufacturing facilities. We regularly review inventory quantities and record a write-down to net realizable value for excess and obsolete inventory. The write-down is primarily based on historical inventory usage adjusted for expected changes in product demand and production requirements. Our industry is characterized by customers in highly-cyclical industries, rapid technological changes, frequent new product developments and rapid product obsolescence. Changes in demand for our products could result in further write-downs.
Property, Plant and Equipment – Property, plant and equipment are recorded at cost upon acquisition. We begin depreciation and amortization when an asset is both in the location and condition for its intended use. Maintenance and repairs are charged to expense as incurred. The cost of property retired or sold and the related accumulated depreciation and amortization are removed from the applicable accounts when disposition occurs and any gain or loss is recognized. Depreciation and amortization are computed using the straight-line method over the estimated useful life of the asset. Useful lives for equipment and machinery range from to
Reviews are regularly performed to determine whether facts and circumstances exist which indicate that the useful life is shorter than originally estimated or the carrying amount of assets may not be recoverable. Impairment, if any, is based on the excess of the carrying amount over the estimated fair value of those assets.
Leases – We determine if a contract or arrangement is, or contains, a lease at inception. Balances related to operating leases are included in right-of-use assets in our Consolidated Balance Sheet. Balances related to financing leases are immaterial and are included in property, plant and equipment, other current liabilities, and long-term lease liability in our Consolidated Balance Sheet. ROU assets represent our right to use an underlying asset for the lease term and lease liabilities represent our obligation to make lease payments arising from the lease.
ROU assets and liabilities are recognized at commencement date based on the present value of lease payments over the lease term. As none of our leases provide an implicit rate, we use our incremental borrowing rate based on the information available at commencement date in determining the present value of lease payments. The ROU asset includes any prepaid lease payments and additional direct costs and excludes lease incentives. Our lease terms may include
55
We lease office space, buildings, land, vehicles and equipment. Lease agreements with an initial term of 12 months or less are not recorded on the balance sheet. Instead, we recognize the lease expense as incurred over the lease term. Our lease agreements do not contain any material residual value guarantees or material restrictive covenants. We have one lease that requires the underlying asset to be returned to its original condition at the end of the lease term.
Intangible Assets – Intangible assets acquired in business combinations are capitalized and subsequently amortized on a straight-line basis over their estimated useful life, if the life is determinable. If the life is not determinable, amortization is not recorded. We regularly perform reviews to determine if facts and circumstances exist which indicate that the useful lives of our intangible assets are shorter than originally estimated or the carrying amount of these assets may not be recoverable. Impairment, if any, is based on the excess of the carrying amount over the estimated fair value of those assets. Patent costs consist primarily of legal and filing fees incurred to file patents on proprietary methods and technology we developed. Patent costs are expensed when incurred, as they are insignificant.
Goodwill – Goodwill is recorded when the purchase price paid for an acquisition exceeds the estimated fair value of net identified tangible and intangible assets acquired. Goodwill is not subject to amortization but is tested for impairment annually or when it is determined that it is more likely than not that the fair value of a reporting unit is less than its carrying amount. If it is concluded that there is a potential impairment, we would recognize an impairment charge for the amount by which the carrying amount exceeds the reporting unit’s fair value (although the loss would not exceed the total amount of goodwill allocated to the reporting unit).
Revenue Recognition – We recognize revenue when a customer obtains control of promised goods or services in an amount that reflects the consideration we expect to receive in exchange for those goods or services. A performance obligation is a promise in a contract to transfer a product or service to the customer. The transaction price of a contract is allocated to each distinct performance obligation based upon the relative standalone selling price for each performance obligation and is recognized as revenue upon satisfaction of the performance obligation, either at a point in time or over time.
Equipment and related product revenues (e.g., furnace systems, system add-ons, machinery, consumables and spare parts) are recognized at a point in time, when they are shipped or delivered, depending on contractual terms. For products where the customer’s defined specifications have not been met with respect to at least two similarly configured systems and processes (i.e., new technology), the revenue and directly-related costs are deferred at the time of shipment and later recognized at the time of customer acceptance or when this criterion has been met.
For installation services related to our current products, revenue is recognized at a point in time, when the equipment is shipped or delivered, depending on contractual terms. The nature of the installation services requires minimal effort and is perfunctory in nature. Therefore, equipment and any related installation are treated as one performance obligation.
Revenue for maintenance and service contracts are recognized over time. Progress in the satisfaction of these performance obligations will be measured using an input method of either time elapsed in the case of fixed-period contracts, or labor hours expended, in the case of project-based contracts.
Revenue is recorded net of customer discounts or rebates, if any. Customers who purchase new systems are provided an assurance-type warranty, generally for periods of
We
56
sales, use, value added, and some excise taxes). Sales taxes are presented on a net basis (excluded from revenues) in our Consolidated Statements of Operations. Our remaining performance obligations as of September 30, 2021, have an original duration of
We will recognize an asset from costs incurred to fulfill a contract only if such costs relate directly to a contract that we can specifically identify, the costs generate or enhance resources that we will use in satisfying performance obligations in the future, and the costs are expected to be recovered. Any assets recognized related to costs to obtain or fulfill a contract are amortized to selling, general and administrative expense on a systematic basis that is consistent with the transfer to the customer of the goods or services to which the asset relates.
In substantially all of our business transactions, we incur incremental costs to obtain contracts with customers, in the form of sales commissions. We maintain a commission program which rewards our sales representatives for system sales and our employees for system sales and other individual goals. We have elected a
We account for shipping and handling activities that occur after control of the related good transfers as fulfillment activities instead of assessing such activities as performance obligations.
Management reviews disaggregated revenue at the operating segment level. Revenue-generating transactions vary between our operating segments due to several factors. For example, lead times vary among our operating segments and among our products. Most of the revenue for our Material and Substrate segment results from the sale of consumables, rather than equipment sales. These consumables have a much shorter production period than equipment produced by our other operating segment. Due to these variations between operating segments, management determined that disaggregated revenue by segment sufficiently depicts how economic factors affect the nature, amount, timing and uncertainty of our revenue and cash flows. See Note 17 for additional information on our reportable business segments.
Contract Assets – Contract assets consist of amounts we are not legally able to invoice but have completed the related performance obligation. These amounts generally arise from variances between the contractual payment terms and the transaction price assigned to the open performance obligations (e.g., we have recognized revenue in an amount greater than the amount that is billable under the contract). There were
Contract Liabilities – Contract liabilities are reflected in current liabilities on the Consolidated Balance Sheets as all performance obligations are expected to be satisfied within the next 12 months. Contract liabilities include customer deposits and deferred profit, if any. Contract liabilities relate to payments invoiced or received in advance of completion of performance obligations under a contract. Contract liabilities are recognized as revenue upon the fulfillment of performance obligations. Contract liabilities consist of customer deposits as of September 30, 2021 and 2020.
Warranty – A limited warranty is provided free of charge, generally for periods of
57
The following is a summary of activity in accrued warranty expense at our continuing operations (in thousands):
|
|
Years Ended September 30, |
|
|||||||||
|
|
2021 |
|
|
2020 |
|
|
2019 |
|
|||
Beginning balance |
|
$ |
|
|
$ |
|
|
$ |
|
|||
Additions for warranties issued during the period |
|
|
|
|
|
|
|
|
|
|||
Reductions in the liability for payments made under |
|
|
( |
) |
|
|
( |
) |
|
|
( |
) |
Changes related to pre-existing warranties |
|
|
( |
) |
|
|
( |
) |
|
|
( |
) |
Currency translation adjustment |
|
|
— |
|
|
|
( |
) |
|
|
( |
) |
Ending balance |
|
$ |
|
|
$ |
|
|
$ |
|
|||
Advertising Expense – Advertising costs are expensed as incurred. Advertising expenses at our continuing operations of $
Stock-Based Compensation – We measure compensation costs relating to share-based payment transactions based upon the grant-date fair value of the award. Those costs are recognized as expense over the requisite service period, which is generally the vesting period, with forfeitures recognized as they occur. We estimate the fair value of stock option awards on the date of grant using the Black-Scholes option-pricing model. The Black-Scholes model requires us to apply highly subjective assumptions, including expected stock price volatility, expected life of the option and the risk-free interest rate.
Research, Development and Engineering Expenses – RD&E expenses consist of the cost of employees, consultants and contractors who design, engineer and develop new products and processes as well as materials and supplies used in producing prototypes. RD&E expenses may vary from period to period depending on the engineering projects in process. Expenses related to engineers working on strategic projects or sustaining engineering projects are recorded in RD&E. However, from time to time we add functionality to our products or develop new products during engineering and manufacturing to fulfill specifications in a customer’s order, in which case the cost of development, along with other costs of the order, are charged to cost of goods sold. When certain contract requirements are met, governmental research and development grants are netted against research, development and engineering expenses.
|
|
Years Ended September 30, |
|
|||||||||
|
|
2021 |
|
|
2020 |
|
|
2019 |
|
|||
Research, development and engineering |
|
$ |
|
|
$ |
|
|
$ |
|
|||
Grants earned |
|
|
— |
|
|
|
( |
) |
|
|
( |
) |
Net research, development and engineering |
|
$ |
|
|
$ |
|
|
$ |
|
|||
Foreign Currency Transactions and Translation – We use the U.S. dollar as our reporting currency. Our operations in the UK, China and other countries are primarily conducted in their functional currencies, the Euro, Renminbi, or the local country currency, respectively. Accordingly, assets and liabilities of the subsidiaries are translated into U.S. dollars at the exchange rate in effect at the balance sheet dates. Income and expense items are translated at the average exchange rate for each month within the year. The resulting translation adjustments are recorded directly in accumulated other comprehensive income (loss), net of tax - foreign currency translation adjustments as a separate component of shareholders’ equity. Net foreign currency transaction gains/losses, including transaction gains/losses on intercompany balances that are not of a long-term investment nature and non-functional currency cash balances, are reported as a separate component of non-operating (income) expense in our Consolidated Statements of Operations.
Income Taxes – We file consolidated federal income tax returns in the United States for all subsidiaries except those in China and the United Kingdom, where separate returns are filed. We compute deferred income tax assets and liabilities based upon cumulative temporary differences between financial reporting and taxable income,
58
carryforwards available and enacted tax laws. We also accrue a liability for uncertain tax positions when it is more likely than not that such tax will be incurred.
Deferred tax assets reflect the tax effects of temporary differences between the carrying value of assets and liabilities for financial reporting purposes and the amounts used for income tax purposes. Deferred tax assets are reduced by a valuation allowance when, in the opinion of management and based on the weight of available evidence, it is more likely than not that all or a portion of the deferred tax asset will not be realized. Each quarter, the valuation allowance is re-evaluated. In 2020, we reversed a portion of the valuation allowance related to foreign deferred tax assets which we have determined will be utilized against net operating income in future years. In 2019, we reversed a portion of the valuation allowance related to net operating loss carryforwards which we had determined would be utilized against net operating income. We will continue to monitor our cumulative income and loss positions in the U.S. and foreign jurisdictions to determine whether full or partial valuation allowances on net deferred tax assets are appropriate
Concentrations of Credit Risk – Our customers are primarily manufacturers of semiconductor substrates and devices and electronic assemblies. Financial instruments that potentially subject us to significant concentrations of credit risk consist principally of cash and trade accounts receivable. Credit risk is managed by performing ongoing credit evaluations of the customers’ financial condition, by requiring significant deposits where appropriate, and by actively monitoring collections. Letters of credit are required of certain customers depending on the size of the order, type of customer or its creditworthiness, and country of domicile.
As of September 30, 2021, one Semiconductor customer individually represented
Refer to Note 19 for information regarding revenue and assets in other countries subject to fluctuation in foreign currency exchange rates.
Fair Value of Financial Instruments – We group our financial assets and liabilities measured at fair value on a recurring basis into three levels, based on the markets in which the assets and liabilities are traded and the reliability of the assumptions used to determine fair value. These levels are:
Level 1 – Valuation is based upon quoted market price for identical instruments traded in active markets.
Level 2 – Valuation is based on quoted market prices for similar instruments in active markets, quoted prices for identical or similar instruments in markets that are not active, and model-based valuation techniques for which all significant assumptions are observable in the market.
Level 3 – Valuation is generated from model-based techniques that use significant assumptions not observable in the market. Valuation techniques include use of discounted cash flow models and similar techniques.
It is our policy to use observable inputs whenever reasonably practicable in order to minimize the use of unobservable inputs when developing fair value measurements. When available, we use quoted market prices to measure fair value. If market prices are not available, the fair value measurement is based on models that use primarily market-based parameters including interest rate yield curves, option volatilities and currency rates. In certain cases, where market rate assumptions are not available, we are required to make judgments about assumptions market participants would use to estimate the fair value of a financial instrument. Changes in the underlying assumptions used, including discount rates and estimates of future cash flows, could significantly affect current or future valuations.
Cash, Cash Equivalents and Restricted Cash – Included in cash and cash equivalents and restricted cash in the Consolidated Balance Sheets are money market funds invested in treasury bills, notes and other direct obligations of the U.S. Treasury and foreign bank operating and time deposit accounts. The fair value of these accounts are based on Level 1 inputs in the fair value hierarchy.
59
Receivables and Payables – The recorded amounts of these financial instruments, including accounts receivable and accounts payable, approximate their fair value because of the short maturities of these instruments. These financial instruments are classified as Level 2 in the fair value hierarchy.
Debt – The recorded amounts of these financial instruments, including long-term debt and current maturities of long-term debt, approximate fair value and are considered Level 2 in the fair value hierarchy.
Recently Issued Accounting Pronouncements
There were no new accounting pronouncements issued or effective as of September 30, 2021 that had or are expected to have a material impact on our consolidated financial statements.
2. Acquisition
On
3. Cybersecurity Incident
On April 12, 2021, we detected a data incident in which attackers acquired data and disabled some of the technology systems used by one of our subsidiaries. Upon learning of the incident, we immediately engaged external counsel and retained a team of third-party forensic, incident response, and security professionals to investigate and determine the full scope of this incident. We also notified law enforcement officials and confirmed that the incident is covered by our insurance. We have completed the investigation of the data incident with assistance from our outside professionals, and indications were that the unauthorized third-party gained access to certain personal information relating to employees and their beneficiaries for some of our operations. There was no indication of any misuse of this information.
Despite this disruption, production continued in our facilities. Our previously disabled subsidiary network is now back up and running securely. Working alongside our security professionals, we were able to bring our subsidiary’s systems online with enhanced security controls. We have deployed an advanced next generation anti-virus and endpoint detection and response tool, as well as Managed Detection & Response services. We remain committed to protecting the security of the personal information entrusted to us and providing high-quality products and service to our customers.
We recorded approximately $
60
4. Earnings Per Share & Diluted Earnings Per Share
Basic EPS is computed by dividing net income (loss) available to common shareholders by the weighted average number of common shares outstanding for the period. Diluted EPS is computed similarly to basic EPS except that the denominator is increased to include the number of additional common shares that would have been outstanding if potentially dilutive common shares had been issued. In the case of a net loss, diluted EPS is calculated in the same manner as basic EPS.
For the years 2021, 2020 and 2019, options for
A reconciliation of the denominators of the basic and diluted EPS calculations follows (in thousands, except per share amounts):
|
|
Years Ended September 30, |
|
|||||||||
|
|
2021 |
|
|
2020 |
|
|
2019 |
|
|||
Numerator: |
|
|
|
|
|
|
|
|
|
|||
Net income (loss) from continuing operations |
|
$ |
|
|
$ |
( |
) |
|
$ |
|
||
Net loss from discontinued operations |
|
$ |
— |
|
|
$ |
( |
) |
|
$ |
( |
) |
Net income (loss) |
|
$ |
|
|
$ |
( |
) |
|
$ |
( |
) |
|
Denominator: |
|
|
|
|
|
|
|
|
|
|||
Weighted-average shares used to compute basic |
|
|
|
|
|
|
|
|
|
|||
Common stock equivalents (1) |
|
|
|
|
|
— |
|
|
|
|
||
Weighted-average shares used to compute diluted |
|
|
|
|
|
|
|
|
|
|||
Basic income (loss) per share from continuing |
|
$ |
|
|
$ |
( |
) |
|
$ |
|
||
Basic loss per share from discontinued |
|
$ |
— |
|
|
$ |
( |
) |
|
$ |
( |
) |
Net income (loss) per basic share |
|
$ |
|
|
$ |
( |
) |
|
$ |
( |
) |
|
Diluted income (loss) per share from continuing |
|
$ |
|
|
$ |
( |
) |
|
$ |
|
||
Diluted loss per share from discontinued |
|
$ |
— |
|
|
$ |
( |
) |
|
$ |
( |
) |
Net income (loss) per diluted share |
|
$ |
|
|
$ |
( |
) |
|
$ |
( |
) |
|
(1) The number of common stock equivalents is calculated using the treasury stock method and the average market price during the period.
5. Restructuring Plans
The table below details the restructuring activity for the years ended September 30, 2021 and 2020. The activity during 2020 is the result of staff reductions at our Massachusetts operations as we evaluated staffing across our Semiconductor operations. The activity during 2021 relates to staff reductions in our Semiconductor and Material and Substrate operations. The outstanding obligations as of September 30, 2021 and 2020 are as follows, in thousands:
|
|
Years Ended September 30, |
|
|||||
|
|
2021 |
|
|
2020 |
|
||
Balance at beginning of the year |
|
$ |
|
|
$ |
|
||
Severance expense, net of adjustments |
|
|
|
|
|
|
||
Cash payments |
|
|
( |
) |
|
|
( |
) |
Balance at the end of the year |
|
$ |
|
|
$ |
|
||
61
During fiscal 2019, the Company and its former Chief Executive Officer and President, Fokko Pentinga, agreed on a transition of leadership, pursuant to which Mr. Pentinga stepped down as the Chief Executive Officer, President and a director of the Company effective December 6, 2018 (the “Effective Date”). In connection with his departure, Mr. Pentinga and the Company entered into a Separation Agreement and General Release of all Claims, dated November 28, 2018 (the “Separation Agreement”). Pursuant to the Separation Agreement, Mr. Pentinga received a severance payment of $
6
The components of inventory are as follows (in thousands):
|
|
September 30, |
|
|
September 30, |
|
||
Purchased parts and raw materials |
|
$ |
|
|
$ |
|
||
Work-in-process |
|
|
|
|
|
|
||
Finished goods |
|
|
|
|
|
|
||
|
|
|
|
|
|
|
||
Excess and obsolete reserves |
|
|
( |
) |
|
|
( |
) |
|
|
$ |
|
|
$ |
|
||
7
The following is a summary of property, plant and equipment (in thousands):
|
|
September 30, |
|
|
September 30, |
|
||
Land |
|
$ |
|
|
$ |
|
||
Buildings |
|
|
|
|
|
|
||
Building and leasehold improvements |
|
|
|
|
|
|
||
Equipment and machinery |
|
|
|
|
|
|
||
Furniture and fixtures |
|
|
|
|
|
|
||
|
|
|
|
|
|
|
||
Accumulated depreciation and amortization |
|
|
( |
) |
|
|
( |
) |
|
|
$ |
|
|
$ |
|
||
Depreciation was $
62
8
The following table provides information about the financial statement classification of our lease balances reported within the Consolidated Balance Sheets as of September 30, 2021 and 2020, in thousands:
|
|
September 30, |
|
|
September 30, |
|
||
Assets |
|
|
|
|
|
|
||
|
$ |
|
|
$ |
|
|||
|
|
|
|
|
|
|||
Total lease assets |
|
$ |
|
|
$ |
|
||
Liabilities |
|
|
|
|
|
|
||
Current |
|
|
|
|
|
|
||
|
$ |
|
|
$ |
|
|||
|
|
|
|
|
|
|||
Non-current |
|
|
|
|
|
|
||
|
|
|
|
|
|
|||
|
|
|
|
|
|
|||
Total lease liabilities |
|
$ |
|
|
$ |
|
||
The following table provides information about the financial statement classification of our lease expenses reported in the Consolidated Statements of Operations for the years ended September 30, 2021 and 2020, in thousands:
|
|
|
|
Years Ended September 30, |
|
|||||
Lease cost |
|
Classification |
|
2021 |
|
|
2020 |
|
||
Operating lease cost |
|
Cost of sales |
|
$ |
|
|
$ |
|
||
Operating lease cost |
|
Selling, general and administrative expenses |
|
|
|
|
|
|
||
Finance lease cost |
|
Cost of sales |
|
|
|
|
|
|
||
Finance lease cost |
|
Selling, general and administrative expenses |
|
|
|
|
|
|
||
Short-term lease cost |
|
Cost of sales |
|
|
|
|
|
|
||
Total lease cost |
|
|
|
$ |
|
|
$ |
|
||
Future minimum lease payments under non-cancelable leases as of September 30, 2021 are as follows, in thousands:
|
|
Operating Leases |
|
|
Finance Leases |
|
|
Total |
|
|||
2022 |
|
$ |
|
|
$ |
|
|
$ |
|
|||
2023 |
|
|
|
|
|
|
|
|
|
|||
2024 |
|
|
|
|
|
|
|
|
|
|||
2025 |
|
|
|
|
|
— |
|
|
|
|
||
2026 |
|
|
|
|
|
— |
|
|
|
|
||
Thereafter |
|
|
|
|
|
— |
|
|
|
|
||
Total lease payments |
|
|
|
|
|
|
|
|
|
|||
Less: Interest |
|
|
|
|
|
|
|
|
|
|||
Present value of lease liabilities |
|
$ |
|
|
$ |
|
|
$ |
|
|||
63
The following table provides information about the remaining lease terms and discount rates applied as of September 30, 2021:
|
|
September 30, |
|
|
Weighted average remaining lease term |
|
|
|
|
Operating leases |
|
|
||
Finance leases |
|
|
||
Weighted average discount rate |
|
|
|
|
Operating leases |
|
|
% |
|
Finance leases |
|
|
% |
|
9. Intangible Assets
Intangible assets consist of the following (in thousands):
|
|
Useful Life |
|
September 30, |
|
|
September 30, |
|
||
Customer lists |
|
|
$ |
|
|
$ |
|
|||
Trade names |
|
|
|
|
|
|
|
|||
|
|
|
|
|
|
|
|
|
||
Accumulated Amortization |
|
|
|
|
( |
) |
|
|
( |
) |
Intangible assets, net |
|
|
|
$ |
|
|
$ |
|
||
During 2021, we periodically assessed whether any indicators of impairment existed related to our intangible assets. As of each interim period end during fiscal 2021, we concluded that a triggering event had not occurred that would more likely than not reduce the fair value of intangible assets below their carrying value.
Amortization expense related to intangible assets at our continuing operations was $
Years Ending September 30, |
|
Amortization |
|
|
2022 |
|
$ |
|
|
2023 |
|
|
|
|
2024 |
|
|
|
|
2025 |
|
|
|
|
2026 |
|
|
|
|
Thereafter |
|
|
|
|
Total |
|
$ |
|
|
64
10. Goodwill
The changes in the carrying amount of goodwill for the year ended September 30, 2021 are as follows (in thousands):
|
|
Semiconductor |
|
|
Material and Substrate |
|
|
Net Goodwill |
|
|||
Goodwill |
|
$ |
|
|
$ |
|
|
$ |
|
|||
Accumulated impairment losses |
|
|
— |
|
|
|
— |
|
|
|
— |
|
Balance at September 30, 2020 |
|
|
|
|
|
|
|
|
|
|||
Goodwill acquired during 2021 |
|
|
— |
|
|
|
|
|
|
|
||
Impairment of goodwill |
|
|
— |
|
|
|
— |
|
|
|
— |
|
Balance at September 30, 2021 |
|
$ |
|
|
$ |
|
|
$ |
|
|||
Goodwill |
|
$ |
|
|
$ |
|
|
$ |
|
|||
Accumulated impairment losses |
|
|
— |
|
|
|
— |
|
|
|
— |
|
Balance at September 30, 2021 |
|
$ |
|
|
$ |
|
|
$ |
|
|||
On March 3, 2021, we acquired Intersurface Dynamics, which has been integrated into our Material and Substrate segment. Under the purchase method of accounting, the purchase price for the acquisition was allocated to the tangible and identifiable intangible assets acquired and liabilities assumed based on their estimated fair values. The excess purchase price over fair value of net assets acquired of approximately $
During 2021, we periodically assessed whether any indicators of impairment existed which would require us to perform an interim impairment review. As of each interim period end during fiscal 2021, we concluded that a triggering event had not occurred that would more likely than not reduce the fair value of our reporting units below their carrying values. We performed our annual test of goodwill for impairment during the fourth quarter of 2021. The results of the goodwill impairment test indicated that the fair values of our Semiconductor and Material and Substrate reporting units were in excess of the carrying values, and, thus, we did not require an impairment charge. While the quantitative analysis indicated
11. Income Taxes
The following note related to income taxes includes both continuing and discontinued operations. The components of income (loss) before provision for income taxes are as follows (in thousands):
|
|
Years Ended September 30, |
|
|||||||||
|
|
2021 |
|
|
2020 |
|
|
2019 |
|
|||
Domestic |
|
$ |
( |
) |
|
$ |
( |
) |
|
$ |
|
|
Foreign |
|
|
|
|
|
|
|
|
( |
) |
||
|
|
$ |
|
|
$ |
( | ) |
|
$ |
( | ) |
|
65
The components of the provision for income taxes are as follows (in thousands):
|
|
Years Ended September 30, |
|
|||||||||
|
|
2021 |
|
|
2020 |
|
|
2019 |
|
|||
Current: |
|
|
|
|
|
|
|
|
|
|||
Domestic federal |
|
$ |
— |
|
|
$ |
( |
) |
|
$ |
— |
|
Foreign |
|
|
|
|
|
|
|
|
|
|||
Foreign withholding taxes |
|
|
|
|
|
|
|
|
|
|||
Domestic state |
|
|
( |
) |
|
|
( |
) |
|
|
|
|
Total current |
|
|
|
|
|
|
|
|
|
|||
Deferred: |
|
|
|
|
|
|
|
|
|
|||
Foreign |
|
|
( |
) |
|
|
( |
) |
|
|
— |
|
Total deferred |
|
|
( |
) |
|
|
( |
) |
|
|
— |
|
Total provision |
|
$ |
|
|
$ |
|
|
$ |
|
|||
The CARES Act, which was signed into law on March 27, 2020, included a provision for a five-year carryback of net operating losses. The Company has assessed the benefit of the provision and utilized a portion of the 2019 net operating loss carryback to offset income from 2018. The income tax provision as of and for the year ended September 30, 2020 reflects such impact.
Due to the tax treatment relating to the sales of SoLayTec and Tempress, we realized income tax benefits of $
A reconciliation of actual income taxes to income taxes at the expected U.S. federal corporate income tax rate is as follows (in thousands, except percentages):
|
|
Years Ended September 30, |
|
|||||||||
|
|
2021 |
|
|
2020 |
|
|
2019 |
|
|||
Federal statutory rate |
|
|
% |
|
|
% |
|
|
% |
|||
Tax expense (benefit) at the federal statutory rate |
|
$ |
|
|
$ |
( |
) |
|
$ |
( |
) |
|
Effect of permanent book-tax differences |
|
|
|
|
|
|
|
|
|
|||
State tax provision |
|
|
|
|
|
|
|
|
|
|||
Valuation allowance for net deferred tax assets |
|
|
|
|
|
|
|
|
|
|||
Uncertain tax items |
|
|
( |
) |
|
|
( |
) |
|
|
|
|
Tax rate differential |
|
|
|
|
|
|
|
|
|
|||
Other items |
|
|
|
|
|
( |
) |
|
|
|
||
|
|
$ |
|
|
$ |
|
|
$ |
|
|||
66
Deferred income taxes reflect the tax effects of temporary differences between the carrying value of assets and liabilities for financial reporting purposes and the amounts used for income tax purposes.
|
|
September 30, |
|
|
September 30, |
|
||
Deferred tax assets (liabilities): |
|
|
|
|
|
|
||
Capitalized inventory costs |
|
$ |
|
|
$ |
|
||
Inventory write-downs |
|
|
|
|
|
|
||
Accrued warranty |
|
|
|
|
|
|
||
Deferred profits |
|
|
— |
|
|
|
|
|
Accruals and reserves not currently deductible |
|
|
|
|
|
|
||
Stock option expense |
|
|
|
|
|
|
||
Federal net operating loss carryforwards |
|
|
|
|
|
|
||
Foreign and state net operating losses |
|
|
|
|
|
|
||
Book vs. tax depreciation and amortization |
|
|
( |
) |
|
|
( |
) |
Foreign tax credits |
|
|
|
|
|
— |
|
|
Other deferred tax assets |
|
|
|
|
|
|
||
Total deferred tax assets |
|
|
|
|
|
|
||
Valuation allowance |
|
|
( |
) |
|
|
( |
) |
Deferred tax assets, net of valuation allowance |
|
$ |
|
|
$ |
|
||
Changes in the deferred tax valuation allowance are as follows (in thousands):
|
|
Years Ended September 30, |
|
|||||
|
|
2021 |
|
|
2020 |
|
||
Balance at the beginning of the year |
|
$ |
|
|
$ |
|
||
Additions (reductions) to valuation allowance |
|
|
|
|
|
( |
) |
|
Balance at the end of the year |
|
$ |
|
|
$ |
|
||
The deferred tax valuation allowance increased by $
As of September 30, 2021, we have federal net operating loss carryforwards of approximately $
We have classified all of our liabilities for uncertain tax positions as income taxes payable long-term. Income taxes payable long-term also includes other items, primarily withholding taxes that are not due until the related
67
intercompany service fees are paid.
|
|
Years Ended September 30, |
|
|||||||||
|
|
2021 |
|
|
2020 |
|
|
2019 |
|
|||
Balance at beginning of the year |
|
$ |
|
|
$ |
|
|
$ |
|
|||
Additions related to tax positions taken in prior |
|
|
— |
|
|
|
— |
|
|
|
|
|
Reductions due to resolution of uncertain tax |
|
|
( |
) |
|
|
( |
) |
|
|
— |
|
Balance at the end of the year |
|
$ |
|
|
$ |
|
|
$ |
|
|||
Approximately $
Amtech and one or more of our subsidiaries file income tax returns in China and other foreign jurisdictions, as well as the U.S. and various states in the U.S. We have not signed any agreements with the Internal Revenue Service, any state or foreign jurisdiction to extend the statute of limitations for any fiscal year. As such, the number of open years is the number of years dictated by statute in each of the respective taxing jurisdictions, but generally is from
12. Long-Term Debt
We have a mortgage note secured by BTU’s real property in Billerica, Massachusetts. The note has a remaining balance of $
Annual maturities relating to our long-term debt as of September 30, 2021 are as follows (in thousands):
|
|
Annual |
|
|
2022 |
|
$ |
|
|
2023 |
|
|
|
|
2024 |
|
|
— |
|
2025 |
|
|
— |
|
2026 |
|
|
— |
|
Thereafter |
|
|
— |
|
Total |
|
$ |
|
|
13. Equity and Stock-Based Compensation
2019 Stock Repurchase Plan
On November 29, 2018, we announced that the Board approved a stock repurchase program, pursuant to which we were authorized to repurchase up to $
68
to management’s discretion and depended on our stock price and other market conditions. The Board could have terminated the repurchase program at any time while it was in effect. The term of our repurchase program expired as of the quarter ended December 31, 2019. There were
2020 Stock Repurchase Plan
On February 4, 2020, the Board approved a new stock repurchase program, pursuant to which we were authorized to repurchase up to $
2021 Stock Repurchase Plan
On February 9, 2021, the Board approved a new stock repurchase program, pursuant to which we may repurchase up to $
Stock-Based Compensation Expense
Stock-based compensation expenses of $
Amtech Equity Compensation Plans
The 2007 Plan, under which
The Non-Employee Directors Stock Option Plan was approved by the shareholders in 1996 for issuance of up to
Equity compensation plans as of September 30, 2021 are summarized in the table below:
Name of Plan |
|
Shares |
|
|
Shares |
|
|
Options |
|
|
Plan |
|||
2007 Plan |
|
|
|
|
|
|
|
|
|
|
||||
Non-Employee Directors Stock Option Plan |
|
|
|
|
|
|
|
|
|
|
||||
|
|
|
|
|
|
|
|
|
|
|
|
|||
69
Stock Options
Stock options issued under the terms of our equity compensation plans have, or will have, an exercise price equal to or greater than the fair market value of the common stock at the date of the option grant and expire no later than
|
|
Years Ended September 30, |
||||
|
|
2021 |
|
2020 |
|
2019 |
Risk free interest rate |
|
|
|
|||
Expected life |
|
|
|
|||
Dividend rate |
|
|
|
|||
Volatility |
|
|
|
|||
The following table summarizes our stock option activity during 2021, 2020 and 2019
|
|
Years Ended September 30, |
|
|||||||||||||||||||||
|
|
2021 |
|
|
2020 |
|
|
2019 |
|
|||||||||||||||
|
|
Options |
|
|
Weighted |
|
|
Options |
|
|
Weighted |
|
|
Options |
|
|
Weighted |
|
||||||
Outstanding at beginning of period |
|
|
|
|
$ |
|
|
|
|
|
$ |
|
|
|
|
|
$ |
|
||||||
Granted |
|
|
|
|
|
|
|
|
|
|
|
|
|
|
|
|
|
|
||||||
Exercised |
|
|
( |
) |
|
|
|
|
|
( |
) |
|
|
|
|
|
( |
) |
|
|
|
|||
Forfeited/expired |
|
|
( |
) |
|
|
|
|
|
( |
) |
|
|
|
|
|
( |
) |
|
|
|
|||
Outstanding at end of period |
|
|
|
|
$ |
|
|
|
|
|
$ |
|
|
|
|
|
$ |
|
||||||
Exercisable at end of period |
|
|
|
|
$ |
|
|
|
|
|
$ |
|
|
|
|
|
$ |
|
||||||
Weighted average grant-date fair value of |
|
$ |
|
|
|
|
|
$ |
|
|
|
|
|
$ |
|
|
|
|
||||||
The following table summarizes information for stock options outstanding and exercisable as of September 30, 2021:
|
|
Options Outstanding |
|
|
Options Exercisable |
|
||||||||||||||
Range of Exercise Prices |
|
Number |
|
|
Remaining |
|
|
Weighted |
|
|
Number |
|
|
Weighted |
|
|||||
|
|
|
|
|
|
|
$ |
|
|
|
|
|
$ |
|
||||||
|
|
|
|
|
|
|
|
|
|
|
|
|
|
|
||||||
|
|
|
|
|
|
|
|
|
|
|
|
|
|
|
||||||
|
|
|
|
|
|
|
|
|
|
|
|
|
|
|
||||||
|
|
|
|
|
|
|
|
|
|
|
— |
|
|
|
— |
|
||||
|
|
|
|
|
|
|
|
|
|
|
|
|
|
|
||||||
|
|
|
|
|
|
|
|
|
|
|
|
|
|
|
||||||
|
|
|
|
|
|
|
|
|
|
|
|
|
|
|
||||||
|
|
|
|
|
|
|
|
|
|
|
|
|
|
|
||||||
|
|
|
|
|
|
|
|
|
|
|
|
|
|
|
||||||
|
|
|
|
|
|
|
|
$ |
|
|
|
|
|
$ |
|
|||||
The aggregate intrinsic values of options outstanding and options exercisable as of September 30, 2021 were $
70
of stock options exercised during the fiscal years ended September 30, 2021, 2020 and 2019 was $
14. Benefit Plans
We have retirement plans covering substantially all our employees. The principal plans are our defined contribution plan that covers substantially all of our employees in the United States and the multi-employer pension plan for hourly union employees in Pennsylvania. Expense related to both plans is insignificant.
Defined Contribution Plan – Domestic employees of Amtech and its subsidiaries who meet certain eligibility requirements may participate, at the employee’s option, in the “401(k) Plan." The 401(k) Plan is a defined contribution plan subject to the provisions of ERISA. We match employee contributions to the 401(k) Plan equal to
Pension Plan – Our hourly union employees in Pennsylvania participate in a multi-employer pension plan, the NIGPP, in accordance with the union agreement between PR Hoffman and the United Automobile, Aerospace and Agriculture Implement Workers of America. The agreement was renewed in 2019 for a
15. Commitments and Contingencies
Purchase Obligations – As of September 30, 2021, we had unrecorded purchase obligations in the amount of $
Legal Proceedings and Other Claims – From time to time, we are a party to claims and actions for matters arising out of our business operations. We regularly evaluate the status of the legal proceedings and other claims in which we are involved to assess whether a loss is probable or there is a reasonable possibility that a loss, or an additional loss, may have been incurred and determine if accruals are appropriate. If accruals are not appropriate, we further evaluate each legal proceeding to assess whether an estimate of possible loss or range of possible loss can be made for disclosure. Although the outcome of claims and litigation is inherently unpredictable, we believe that we have adequate provisions for any probable and estimable losses. It is possible, nevertheless, that our consolidated financial position, results of operations or liquidity could be materially and adversely affected in any particular period by the resolution of a claim or legal proceeding. Legal expenses related to defense, negotiations, settlements, rulings and advice of outside legal counsel are expensed as incurred.
Employment Contracts – We have employment contracts and change in control agreements with, and severance plans covering, certain officers and management employees under which severance payments would become payable in the event of specified terminations without cause or terminations under certain circumstances after a change in control. If severance payments under the current employment contracts or severance plans were to become payable, the severance payments would generally range from to
16. Cash Flows
Non-cash investing activities may include capital expenditures in accounts payable, representing additions purchased at period end but not yet paid in cash. There were
71
17. Business Segments
Upon the acquisition of Intersurface Dynamics in the second quarter of 2021 (see Note 2), we evaluated our organizational structure and concluded that we have two reportable business segments following the acquisition. Prior period amounts have been revised to conform to the current period segment reporting structure.
Our
Semiconductor – We design, manufacture, sell and service thermal processing equipment and related controls for use by leading semiconductor manufacturers, and in electronics, automotive and other industries.
Material and Substrate – We produce consumables and machinery for lapping (fine abrading) and polishing of materials, such as sapphire substrates, optical components, silicon wafers, numerous types of crystal materials, ceramics and metal components. Our Material and Substrate segment includes our former SiC/LED segment in addition to Intersurface Dynamics, as they sell complementary products to a similar market.
Information concerning our business segments is as follows (in thousands):
|
|
Years Ended September 30, |
|
|||||||||
|
|
2021 |
|
|
2020 |
|
|
2019 |
|
|||
Net revenue: |
|
|
|
|
|
|
|
|
|
|||
Semiconductor |
|
$ |
|
|
$ |
|
|
$ |
|
|||
Material and Substrate |
|
|
|
|
|
|
|
|
|
|||
Non-segment related |
|
|
|
|
|
|
|
|
|
|||
|
|
$ |
|
|
$ |
|
|
$ |
|
|||
Operating income (loss): |
|
|
|
|
|
|
|
|
|
|||
Semiconductor |
|
$ |
|
|
$ |
|
|
$ |
|
|||
Material and Substrate |
|
|
|
|
|
|
|
|
|
|||
Non-segment related |
|
|
( |
) |
|
|
( |
) |
|
|
( |
) |
|
|
$ |
|
|
$ |
( |
) |
|
$ |
|
||
|
|
Years Ended September 30, |
|
|||||||||
|
|
2021 |
|
|
2020 |
|
|
2019 |
|
|||
Capital expenditures: |
|
|
|
|
|
|
|
|
|
|||
Semiconductor |
|
$ |
|
|
$ |
|
|
$ |
|
|||
Material and Substrate |
|
|
|
|
|
|
|
|
|
|||
Non-segment related |
|
|
|
|
|
|
|
|
|
|||
|
|
$ |
|
|
$ |
|
|
$ |
|
|||
Depreciation and amortization expense: |
|
|
|
|
|
|
|
|
|
|||
Semiconductor |
|
$ |
|
|
$ |
|
|
$ |
|
|||
Material and Substrate |
|
|
|
|
|
|
|
|
|
|||
Non-segment related |
|
|
|
|
|
|
|
|
|
|||
|
|
$ |
|
|
$ |
|
|
$ |
|
|||
|
|
September 30, |
|
|
September 30, |
|
||
Identifiable assets: |
|
|
|
|
|
|
||
Semiconductor |
|
$ |
|
|
$ |
|
||
Material and Substrate |
|
|
|
|
|
|
||
Non-segment related* |
|
|
|
|
|
|
||
|
|
$ |
|
|
$ |
|
||
* Non-segment related assets include cash, property and other assets.
72
18. Major Customers and Sales by Country
In 2021, two Semiconductor customers accounted for
Our net revenues for 2021, 2020 and 2019 were to customers in the following geographic regions:
|
|
Years Ended September 30, |
|
|||||||||
|
|
2021 |
|
|
2020 |
|
|
2019 |
|
|||
United States |
|
|
% |
|
|
% |
|
|
% |
|||
Other |
|
|
% |
|
|
% |
|
|
% |
|||
Total Americas |
|
|
% |
|
|
% |
|
|
% |
|||
China |
|
|
% |
|
|
% |
|
|
% |
|||
Malaysia |
|
|
% |
|
|
% |
|
|
% |
|||
Taiwan |
|
|
% |
|
|
% |
|
|
% |
|||
Other |
|
|
% |
|
|
% |
|
|
% |
|||
Total Asia |
|
|
% |
|
|
% |
|
|
% |
|||
Germany |
|
|
% |
|
|
% |
|
|
% |
|||
Other |
|
|
% |
|
|
% |
|
|
% |
|||
Total Europe |
|
|
% |
|
|
% |
|
|
% |
|||
|
|
|
% |
|
|
% |
|
|
% |
|||
19
We have continuing operations in the United States and China, as well as satellite offices in Europe and Asia. Revenues, operating income (loss) and identifiable assets by geographic region are as follows (in thousands):
|
|
Years Ended September 30, |
|
|||||||||
|
|
2021 |
|
|
2020 |
|
|
2019 |
|
|||
Net revenue: |
|
|
|
|
|
|
|
|
|
|||
United States* |
|
$ |
|
|
$ |
|
|
$ |
|
|||
China |
|
|
|
|
|
|
|
|
|
|||
Other |
|
|
|
|
|
|
|
|
|
|||
|
|
$ |
|
|
$ |
|
|
$ |
|
|||
Operating income (loss): |
|
|
|
|
|
|
|
|
|
|||
United States* |
|
$ |
( |
) |
|
$ |
( |
) |
|
$ |
|
|
China |
|
|
|
|
|
|
|
|
|
|||
Other |
|
|
|
|
|
|
|
|
|
|||
|
|
$ |
|
|
$ |
( |
) |
|
$ |
|
||
* United States revenue includes $
|
|
As of September 30, |
|
|||||
|
|
2021 |
|
|
2020 |
|
||
Net property, plant and equipment: |
|
|
|
|
|
|
||
United States |
|
$ |
|
|
$ |
|
||
China |
|
|
|
|
|
|
||
|
|
$ |
|
|
$ |
|
||
73
20. Supplementary Financial Information
The following is a summary of the activity in our allowance for doubtful accounts (in thousands):
|
|
Years Ended September 30, |
|
|||||||||
|
|
2021 |
|
|
2020 |
|
|
2019 |
|
|||
Balance at beginning of year |
|
$ |
|
|
$ |
|
|
$ |
|
|||
Provision |
|
|
|
|
|
|
|
|
|
|||
Write offs |
|
|
( |
) |
|
|
( |
) |
|
|
( |
) |
Adjustment (1) |
|
|
( |
) |
|
|
( |
) |
|
|
( |
) |
Balance at end of year |
|
$ |
|
|
$ |
|
|
$ |
|
|||
(1) Primarily foreign currency translation adjustments.
21. Discontinued Operations and Disposals
Discontinued Operations
In April 2019, we announced that the Board determined that it was in the long-term best interest of Amtech to exit the solar business segment and focus our strategic efforts on our non-Solar business segments in order to more fully realize the opportunities presented in those areas.
The Board made its decision, effective March 28, 2019, after analyzing current market conditions and the strategic outlook for its Solar segment, which operates in a highly competitive market among lower cost manufacturers, particularly in China. Historical fluctuations in the solar cell industry combined with downward pricing pressure has negatively affected our results of operations in recent years. In response, we had been pursuing strategic alternatives for the continued operations of the Solar segment, including the possibility of restructuring the Solar segment to achieve profitability and compete more effectively. After further assessment, however (including input from management of the Solar segment and our external advisors), the Board determined that the investment required to return our solar business to profitability would be better utilized to pursue strategic opportunities in our non-Solar business units.
The divestiture of our solar business included our Tempress and SoLayTec subsidiaries, which comprised substantially all of our Solar segment. We adopted a plan to sell our Solar operations on or before March 31, 2020. As such, we classified substantially all of the Solar segment as held for sale in our Consolidated Balance Sheets and reported its results as discontinued operations in our Consolidated Statements of Operations.
On June 7, 2019 (“SoLayTec Sale Date”), we completed the sale of SoLayTec to a third party located in the Netherlands. Upon the SoLayTec Sale Date, we recognized a gain of approximately $
Effective January 22, 2020 (“Tempress Sale Date”), we completed the sale of Tempress for nominal consideration to a third party located in the Netherlands. In connection with this sale transaction, we provided an unsecured term loan to Tempress in the principal sum of $
74
Operating results of our discontinued solar operations were as follows, in thousands:
|
|
Years Ended September 30, |
|
|||||
|
|
2020 |
|
|
2019 |
|
||
Revenues, net of returns and allowances |
|
$ |
|
|
$ |
|
||
Cost of sales |
|
|
|
|
|
|
||
Gross profit |
|
|
|
|
|
|
||
Selling, general and administrative |
|
|
|
|
|
|
||
Research, development and engineering |
|
|
|
|
|
|
||
Restructuring charges |
|
|
|
|
|
|
||
Operating loss |
|
|
( |
) |
|
|
( |
) |
(Loss) gain on sale of subsidiary |
|
|
( |
) |
|
|
|
|
Interest expense and other, net |
|
|
( |
) |
|
|
( |
) |
Loss from discontinued operations |
|
|
( |
) |
|
|
( |
) |
Income tax benefit |
|
|
( |
) |
|
|
( |
) |
Net loss |
|
$ |
( |
) |
|
$ |
( |
) |
Amtech’s Consolidated Statement of Cash flows combines cash flows from discontinued operations with cash flows from continuing operations within each cash flow statement category.
|
|
Years Ended September 30, |
|
|||||
|
|
2020 |
|
|
2019 |
|
||
Loss from discontinued operations, net of tax |
|
$ |
( |
) |
|
$ |
( |
) |
Depreciation and amortization |
|
$ |
|
|
$ |
|
||
(Reversal of) provision for allowance for doubtful |
|
$ |
( |
) |
|
$ |
|
|
(Loss) gain on sale of subsidiary |
|
$ |
( |
) |
|
$ |
|
|
Purchases of property, plant and equipment |
|
$ |
|
|
$ |
|
||
Other Disposals
R2D – On December 13, 2019 (“R2D Sale Date”), we finalized the sale of R2D to certain members of R2D’s management team. Upon the sale, we recognized a loss of approximately $
75
22. Selected Quarterly Data (Unaudited)
The following table sets forth selected unaudited consolidated quarterly financial information for the years ended September 30, 2021 and 2020 (in thousands, except percentages and per share amounts):
|
|
Fiscal Year 2021 |
|
|||||||||||||
|
|
First |
|
|
Second |
|
|
Third |
|
|
Fourth |
|
||||
Revenue, net of returns and allowances |
|
$ |
|
|
$ |
|
|
$ |
|
|
$ |
|
||||
Cost of sales |
|
|
|
|
|
|
|
|
|
|
|
|
||||
Gross profit |
|
|
|
|
|
|
|
|
|
|
|
|
||||
Selling, general and administrative |
|
|
|
|
|
|
|
|
|
|
|
|
||||
Research, development and engineering |
|
|
|
|
|
|
|
|
|
|
|
|
||||
Restructuring charges |
|
|
— |
|
|
|
— |
|
|
|
|
|
|
|
||
Operating income |
|
|
|
|
|
|
|
|
|
|
|
|
||||
Interest (expense) income and other, net |
|
|
( |
) |
|
|
|
|
|
( |
) |
|
|
|
||
Income from continuing operations |
|
|
|
|
|
|
|
|
|
|
|
|
||||
Income tax provision |
|
|
|
|
|
|
|
|
|
|
|
|
||||
Net income (loss) |
|
$ |
|
|
$ |
( |
) |
|
$ |
|
|
$ |
|
|||
Gross margin |
|
|
% |
|
|
% |
|
|
% |
|
|
% |
||||
Operating margin |
|
|
% |
|
|
% |
|
|
% |
|
|
% |
||||
Income (Loss) Per Share: |
|
|
|
|
|
|
|
|
|
|
|
|
||||
Net income (loss) per basic share |
|
$ |
|
|
$ |
( |
) |
|
$ |
|
|
$ |
|
|||
Weighted average shares outstanding - basic |
|
|
|
|
|
|
|
|
|
|
|
|
||||
Net income (loss) per diluted share |
|
$ |
|
|
$ |
( |
) |
|
$ |
|
|
$ |
|
|||
Weighted average shares outstanding - diluted |
|
|
|
|
|
|
|
|
|
|
|
|
||||
76
|
|
Fiscal Year 2020 |
|
|||||||||||||
|
|
First |
|
|
Second |
|
|
Third |
|
|
Fourth |
|
||||
Revenue, net of returns and allowances |
|
$ |
|
|
$ |
|
|
$ |
|
|
$ |
|
||||
Cost of sales |
|
|
|
|
|
|
|
|
|
|
|
|
||||
Gross profit |
|
|
|
|
|
|
|
|
|
|
|
|
||||
Selling, general and administrative |
|
|
|
|
|
|
|
|
|
|
|
|
||||
Research, development and engineering |
|
|
|
|
|
|
|
|
|
|
|
|
||||
Restructuring charges |
|
|
— |
|
|
|
— |
|
|
|
|
|
|
— |
|
|
Operating income (loss) |
|
|
|
|
|
( |
) |
|
|
|
|
|
( |
) |
||
Loss on sale of subsidiary |
|
|
( |
) |
|
|
— |
|
|
|
— |
|
|
|
— |
|
Interest (expense) income and other, net |
|
|
( |
) |
|
|
|
|
|
( |
) |
|
|
( |
) |
|
(Loss) income from continuing operations before |
|
|
( |
) |
|
|
( |
) |
|
|
|
|
|
( |
) |
|
Income tax provision |
|
|
|
|
|
|
|
|
|
|
|
|
||||
Loss from continuing operations, |
|
|
( |
) |
|
|
( |
) |
|
|
( |
) |
|
|
( |
) |
Loss from discontinued operations, |
|
|
( |
) |
|
|
( |
) |
|
|
— |
|
|
|
— |
|
Net loss |
|
$ |
( |
) |
|
$ |
( |
) |
|
$ |
( |
) |
|
$ |
( |
) |
Gross margin |
|
|
% |
|
|
% |
|
|
% |
|
|
% |
||||
Operating margin |
|
|
% |
|
|
( |
)% |
|
|
% |
|
|
( |
)% |
||
Loss Per Basic Share: |
|
|
|
|
|
|
|
|
|
|
|
|
||||
Basic loss per share from continuing |
|
$ |
( |
) |
|
$ |
( |
) |
|
$ |
( |
) |
|
$ |
( |
) |
Basic loss per share from discontinued |
|
$ |
( |
) |
|
$ |
( |
) |
|
$ |
— |
|
|
$ |
— |
|
Net loss per basic share |
|
$ |
( |
) |
|
$ |
( |
) |
|
$ |
( |
) |
|
$ |
( |
) |
Loss Per Diluted Share: |
|
|
|
|
|
|
|
|
|
|
|
|
||||
Diluted loss per share from continuing |
|
$ |
( |
) |
|
$ |
( |
) |
|
$ |
( |
) |
|
$ |
( |
) |
Diluted loss per share from discontinued |
|
$ |
( |
) |
|
$ |
( |
) |
|
$ |
— |
|
|
$ |
— |
|
Net loss per diluted share |
|
$ |
( |
) |
|
$ |
( |
) |
|
$ |
( |
) |
|
$ |
( |
) |
Weighted average shares outstanding - basic |
|
|
|
|
|
|
|
|
|
|
|
|
||||
Weighted average shares outstanding - diluted |
|
|
|
|
|
|
|
|
|
|
|
|
||||
77
ITEM 9. CHANGES IN AND DISAGREEMENTS WITH ACCOUNTANTS ON ACCOUNTING AND FINANCIAL DISCLOSURE
None.
ITEM 9A. CONTROLS AND PROCEDURES
Conclusion Regarding the Effectiveness of Disclosure Controls and Procedures
Our management, including our Chief Executive Officer (“CEO”) and Chief Financial Officer (“CFO”), has carried out an evaluation of the effectiveness of our disclosure controls and procedures as defined in Exchange Act Rules 13a-15(e) and 15(d)-15(e). Based upon that evaluation, our CEO and CFO have concluded that our disclosure controls and procedures in place were effective as of September 30, 2021.
Management’s Report on Internal Control Over Financial Reporting
To the Shareholders of Amtech Systems, Inc.
The management of Amtech Systems, Inc. is responsible for establishing and maintaining adequate internal control over financial reporting, as such term is defined in Exchange Act Rules 13a-15(f) and 15d-15(f). Internal control over financial reporting is a process designed to provide reasonable assurance regarding the reliability of financial reporting and the preparation of financial statements for external purposes in accordance with generally accepted accounting principles.
Because of its inherent limitations, our controls and procedures may not prevent or detect misstatements. A control system, no matter how well conceived and operated, can provide only reasonable, not absolute, assurance that the objectives of the controls system are met. Because of the inherent limitations in all controls systems, no evaluation of controls can provide absolute assurance that all control issues and instances of fraud, if any, have been detected.
Our management evaluated the effectiveness of our internal control over financial reporting as of September 30, 2021. In making this evaluation, we used the criteria set forth by the Committee of Sponsoring Organizations of the Treadway Commission (COSO) in Internal Control - Integrated Framework (2013). Based on our evaluation we believe that, as of September 30, 2021, our internal control over financial reporting was effective based on those criteria.
Changes in Internal Control Over Financial Reporting
There have not been any changes in the Company’s internal control over financial reporting (as such term is defined in Rules 13a-15(f) and 15d-15(f) under the Exchange Act) during the quarter ended September 30, 2021 that materially affected, or are reasonably likely to materially affect, the internal control over financial reporting of the Company.
ITEM 9B. OTHER INFORMATION
None.
ITEM 9C. DISCLOSURE REGARDING FOREIGN JURISDICTIONS THAT PREVENT INSPECTIONS
Not applicable.
78
PART III
Pursuant to Paragraph G(3) of the General Instructions to Form 10-K, the information required by Part III of Form 10-K is incorporated by reference to the Proxy Statement to be filed within 120 days of September 30, 2021, our fiscal year end. In the event the Proxy Statement is not filed within 120 days, the information required by Part III of this Form 10-K will be filed pursuant to an amendment to this Annual Report on Form 10-K within the 120-day period.
ITEM 10. DIRECTORS, EXECUTIVE OFFICERS AND GOVERNANCE
The information required by this item (i) is incorporated herein by reference to the Proxy Statement or (ii) will be filed pursuant to an amendment to this Annual Report on Form 10-K, in each case, within 120 days of September 30, 2021, our fiscal year end.
ITEM 11. EXECUTIVE COMPENSATION
The information required by this item (i) is incorporated herein by reference to the Proxy Statement or (ii) will be filed pursuant to an amendment to this Annual Report on Form 10-K, in each case, within 120 days of September 30, 2021, our fiscal year end.
ITEM 12. SECURITY OWNERSHIP OF CERTAIN BENEFICIAL OWNERS AND MANAGEMENT AND RELATED STOCKHOLDER MATTERS
The information required by this item (i) is incorporated herein by reference to the Proxy Statement or (ii) will be filed pursuant to an amendment to this Annual Report on Form 10-K, in each case, within 120 days of September 30, 2021, our fiscal year end.
The information required by this item (i) is incorporated herein by reference to the Proxy Statement or (ii) will be filed pursuant to an amendment to this Annual Report on Form 10-K, in each case, within 120 days of September 30, 2021, our fiscal year end.
ITEM 14. PRINCIPAL ACCOUNTING FEES AND SERVICES
The information required by this item (i) is incorporated herein by reference to the Proxy Statement or (ii) will be filed pursuant to an amendment to this Annual Report on Form 10-K, in each case, within 120 days of September 30, 2021, our fiscal year end.
79
PART IV
ITEM 15. EXHIBITS AND FINANCIAL STATEMENT SCHEDULES
(a) Financial Statements and Schedules
The consolidated financial statements required by this item are set forth on the pages indicated in Item 8.
All financial statement schedules are omitted because they are either not applicable or because the required information is shown in the consolidated financial statements or notes thereto.
(b) Exhibits
The exhibits filed as part of this Annual Report on Form 10-K are listed on the Exhibit Index immediately preceding the signature page hereto, which is incorporated herein by reference.
ITEM 16. FORM 10-K SUMMARY
None.
EXHIBIT INDEX
|
|
|
|
INCORPORATED BY REFERENCE |
|
|
||||||
EXHIBIT NO. |
|
EXHIBIT DESCRIPTION |
|
FORM |
|
FILE NO. |
|
EXHIBIT NO. |
|
FILING DATE |
|
FILED HEREWITH |
|
|
|
|
|
|
|
|
|
|
|
|
|
3.1 |
|
Amended and Restated Articles of Incorporation, as amended through February 6, 2012. |
|
10-Q |
|
000-11412 |
|
3.1 |
|
February 9, 2012 |
|
|
|
|
|
|
|
|
|
|
|
|
|
|
|
3.2 |
|
Amended and Restated Bylaws of Amtech Systems, Inc., dated as of September 23, 2020. |
|
8-K |
|
000-11412 |
|
3.1 |
|
September 25, 2020 |
|
|
|
|
|
|
|
|
|
|
|
|
|
|
|
4.1 |
|
|
|
|
|
|
|
|
|
|
X |
|
|
|
|
|
|
|
|
|
|
|
|
|
|
10.1 |
|
Non-Employee Directors Stock Option Plan, effective July 8, 2005 as amended through May 8, 2014. |
|
8-K |
|
000-11412 |
|
10.1 |
|
May 14, 2014 |
|
|
|
|
|
|
|
|
|
|
|
|
|
|
|
10.1a |
|
Amendment to the Non-Employee Directors Stock Option Plan, effective March 4, 2020 |
|
DEF14A |
|
000-11412 |
|
Appendix A |
|
January 24, 2020 |
|
|
|
|
|
|
|
|
|
|
|
|
|
|
|
10.2 |
|
2007 Employee Stock Incentive Plan of Amtech Systems, Inc., as amended, effective April 9, 2015. |
|
8-K |
|
000-11412 |
|
10.4 |
|
April 10, 2015 |
|
|
|
|
|
|
|
|
|
|
|
|
|
|
|
10.2a |
|
Amendment to 2007 Employee Stock Incentive Plan of Amtech Systems, Inc., effective March 6, 2019 |
|
DEF14A |
|
000-11412 |
|
Appendix A |
|
January 25, 2019 |
|
|
|
|
|
|
|
|
|
|
|
|
|
|
|
10.3 |
|
|
10-Q |
|
000-11412 |
|
10.1 |
|
February 9, 2012 |
|
|
|
|
|
|
|
|
|
|
|
|
|
|
|
|
80
10.4 |
|
|
10-Q |
|
000-11412 |
|
10.2 |
|
August 9, 2012 |
|
|
|
|
|
|
|
|
|
|
|
|
|
|
|
|
10.5 |
|
|
10-Q |
|
000-11412 |
|
10.15 |
|
August 8, 2013 |
|
|
|
|
|
|
|
|
|
|
|
|
|
|
|
|
10.6 |
|
|
8-K |
|
000-11412 |
|
10.1 |
|
April 10, 2015 |
|
|
|
|
|
|
|
|
|
|
|
|
|
|
|
|
10.7 |
|
|
8-K |
|
000-11412 |
|
10.1 |
|
November 19, 2015 |
|
|
|
|
|
|
|
|
|
|
|
|
|
|
|
|
21.1 |
|
|
|
|
|
|
|
|
|
|
X |
|
|
|
|
|
|
|
|
|
|
|
|
|
|
23.1 |
|
Consent of Independent Registered Public Accounting Firm - Mayer Hoffman McCann P.C. |
|
|
|
|
|
|
|
|
|
X |
|
|
|
|
|
|
|
|
|
|
|
|
|
24 |
|
|
|
|
|
|
|
|
|
|
X |
|
|
|
|
|
|
|
|
|
|
|
|
|
|
31.1 |
|
|
|
|
|
|
|
|
|
|
X |
|
|
|
|
|
|
|
|
|
|
|
|
|
|
31.2 |
|
|
|
|
|
|
|
|
|
|
X |
|
|
|
|
|
|
|
|
|
|
|
|
|
|
32.1 |
|
|
|
|
|
|
|
|
|
|
X |
|
|
|
|
|
|
|
|
|
|
|
|
|
|
32.2 |
|
|
|
|
|
|
|
|
|
|
X |
|
|
|
|
|
|
|
|
|
|
|
|
|
|
81
101.INS |
|
Inline XBRL Instance Document – the instance document does not appear in the Interactive Data File because its XBRL tags are embedded within the Inline XBRL document. |
|
|
|
|
|
|
|
|
|
X |
101.SCH |
|
Inline XBRL Taxonomy Extension Schema Document |
|
|
|
|
|
|
|
|
|
X |
101.PRE |
|
Inline Taxonomy Presentation Linkbase Document |
|
|
|
|
|
|
|
|
|
X |
101.CAL |
|
Inline XBRL Taxonomy Calculation Linkbase Document |
|
|
|
|
|
|
|
|
|
X |
101.LAB |
|
Inline XBRL Taxonomy Label Linkbase Document |
|
|
|
|
|
|
|
|
|
X |
101.DEF |
|
Inline XBRL Taxonomy Extension Definition Linkbase Document |
|
|
|
|
|
|
|
|
|
X |
104 |
|
The cover page for the Company’s Annual Report on Form 10-K for the year ended September 30, 2021, has been formatted in Inline XBRL |
|
|
|
|
|
|
|
|
|
X |
82
SIGNATURES
Pursuant to the requirements of Section 13 or 15(d) of the Securities Exchange Act of 1934, as amended, the registrant has duly caused this report to be signed on its behalf by the undersigned, thereunto duly authorized.
|
AMTECH SYSTEMS, INC. |
||
|
|
||
November 17, 2021 |
By: |
/s/ Lisa D. Gibbs |
|
|
|
Lisa D. Gibbs, Vice President, Chief Financial Officer and Director |
|
|
|
(Principal Financial Officer and Duly Authorized Officer) |
|
Pursuant to the requirements of the Securities Exchange Act of 1934, as amended, this report on Form 10-K has been signed below by the following persons on behalf of the registrant and in the capacities and on the dates indicated:
SIGNATURE |
|
TITLE |
|
DATE |
|
|
|
|
|
* |
|
Chief Executive Officer and Director |
|
November 17, 2021 |
Michael Whang |
|
(Principal Executive Officer) |
|
|
|
|
|
|
|
/s/ Lisa D. Gibbs |
|
Vice President, Chief Financial Officer and Director |
|
November 17, 2021 |
Lisa D. Gibbs |
|
(Principal Financial Officer and Principal Accounting Officer) |
|
|
|
|
|
|
|
* |
|
Chairman of the Board |
|
November 17, 2021 |
Jong S. Whang |
|
|
|
|
* |
|
Director |
|
November 17, 2021 |
Robert M. Averick |
|
|
|
|
|
|
|
|
|
* |
|
Director |
|
November 17, 2021 |
Robert C. Daigle |
|
|
|
|
|
|
|
|
|
* |
|
Director |
|
November 17, 2021 |
Michael Garnreiter |
|
|
|
|
|
|
|
|
|
* |
|
Director |
|
November 17, 2021 |
Sukesh Mohan |
|
|
|
|
|
|
|
|
|
*By: /s/ Lisa D. Gibbs |
|
|
|
|
Lisa D. Gibbs, Attorney-In-Fact** |
|
|
|
|
** By authority of the power of attorney filed as Exhibit 24 hereto.
83